Opinion
FOOD BANKS


Open Letter to The Honourable Mona Fortier, Minister of Middle Class Prosperity
December 4, 2020
FOR IMMEDIATE RELEASE
Red Deer – Mountain View, AB
Feed Ontario recently released “Hunger Report 2020”. The report highlights some troubling details surrounding food bank usage in Ontario between April 1, 2019 and June 30, 2020.
While usage during the pandemic is concerning, it is the pre-pandemic figures that are truly concerning. Between April 1, 2019 and March 31, 2020, 537,575 Ontarians accessed food banks (5.3% increase over the previous year).
The report also indicates that nearly half of food bank visitors worried about getting evicted or defaulting on mortgage payments in the coming months. Additionally, 93% reported borrowing money, accessing payday loans or using credit cards to pay for monthly necessities.
As Prime Minister Trudeau has stated, “We [Federal government] took on debt so Canadians wouldn’t have to.”
The Hunger Report 2020 indicates otherwise.
According to your December 2019 mandate letter from the Prime Minister, your ministerial position was created with the intention of improving the use of data in government decision-making.
The food bank usage data should be the only data needed to indicate that Canadians are struggling.
We do not want handouts and subsidy programs. We want to work, to provide for our families and to support vulnerable individuals within our communities.
Canadians are urging you to act on their behalf to reduce government red-tape, end crony capitalism, stop corporate subsidies, put aside plans for a “green economy”, encourage free market competition and stop the war on work.
Sincerely,
Jared Pilon
Candidate for Red Deer – Mountain View, AB
With the Americans winning the first game 3-1, a sense of panic crept over Canada as it headed to Game 2 in Boston. Losing a political battle with Trump was bad enough, but losing hockey bragging rights heading into a federal election was catastrophic for the Family Compact.
“It’s also more political than the (1972) Summit Series was, because Canada’s existence wasn’t on the line then, and it may be now. You’re damn right Canadians should boo the (U.S.) anthem.” Toronto Star columnist Bruce Arthur before Gm. 1 of USA/ Canada in The 4 Nations Cup.
The year 2025 is barely half over on Canada Day. There is much to go before we start assembling Best Of Lists for the year. But as Palestinian flags duel with the Maple Leaf for prominence on the 158th anniversary of Canada’s becoming a sovereign country it’s a fair guess that we will settle on Febuary 21 as the pivotal date of the year— and Canada’s destiny as well.
That was the date of Game 2 in the U.S./Canada rivalry at the Four Nations Tournament. Ostensibly created by the NHL to replace the moribund All Star format, the showdown of hockey nations in Boston became much more. Jolted by non-sports factors it became a pivotal moment in modern Canadian history.
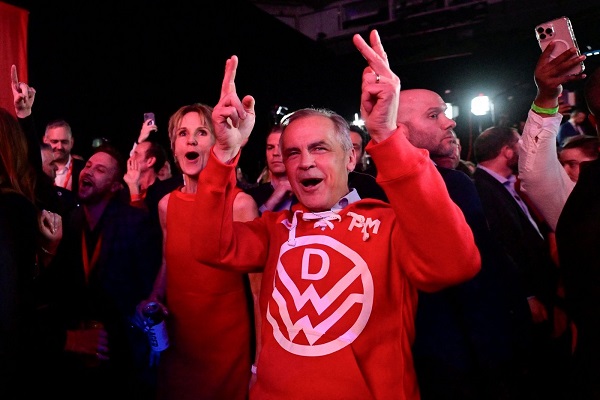
Set against U.S. president Donald Trump’s bellicose talk of Canada as a U.S. state and the Mike Myers/ Mark Carney Elbows Up ad campaign, the gold-medal game evoked, for those of a certain age, memories of the famous 1972 Summit Series between Canada and the USSR. And somehow produced an unprecedented political reversal in Canadian elections.
As we wrote on Feb. 16 after Gm. 1 in Montreal, the Four Nations had been meant to be something far less incendiary. “Expecting a guys’ weekend like the concurrent NBA All Star game, the fraternal folks instead got a Pier Six brawl. It was the most stunning beginning to a game most could remember in 50 years. (Not least of all the rabid Canadian fanbase urging patriotism in the home of Quebec separation) Considering this Four Nations event was the NHL’s idea to replace the tame midseason All Star Game where players apologize for bumping into each other during a casual skate, the tumult as referees tried to start the game was shocking.
“Despite public calls for mutual respect, the sustained booing of the American national anthem and the Team Canada invocation by MMA legend Georges St. Pierre was answered by the Tkachuck brothers, Matthew and Brady, with a series of fights in the first nine seconds of the game. Three fights to be exact ,when former Canuck J.T. Miller squared up with Brandon Hagel. (All three U.S. players have either played on or now play for Canadian NHL teams.)
“Premeditated and nasty. To say nothing of the vicious mugging of Canada’s legend Sidney Crosby behind the U.S. net moments later by Charlie McEvoy.”
With the Americans winning the game 3-1 on Feb. 15, a sense of panic crept over Canada as it headed to Game 2 in Boston. Losing a political battle with Trump was bad enough, but losing hockey bragging rights heading into a federal election was catastrophic for the Family Compact. As we wrote in the aftermath, a slaughter was avoided.

“In the rematch for a title created just weeks before by the NHL the boys stuck to hockey. Anthem booing was restrained. Outside of an ill-advised appearance by Wayne Gretzky— now loathed for his Trump support— the emphasis was on skill. Playing largely without injured Matthew and Brady Tkachuk and McAvoy, the U.S. forced the game to OT where beleaguered goalie Craig Binnington held Canada in the game until Connor McDavid scored the game winner. “
The stunning turnaround in the series produced a similar turnaround in the Canadian federal election. Galvanized by Trump’s 51st State disrespect and exhilarated by the hockey team’s comeback, voters switched their votes in huge numbers to Carney, ignoring the abysmal record of the Liberals and their pathetic polling. From Pierre Poilievre having a 20-point lead in polls, hockey-besotted Canada flipped to award Carney a near-majority in the April 28 election.
The result stunned the Canadian political class and international critics who questioned how a single sporting event could have miraculously rescued the Liberals from themselves in such a short time.

While Canada soared because of the four Nations, a Canadian icon crashed to earth. “Perhaps the most public outcome was the now-demonization of Gretzky in Canada. Just as they had with Bobby Orr, another Canadian superstar living in America, Canadians wiped their hands of No. 99 over politics. Despite appeals from Orr, Don Cherry and others, the chance to make Gretzky a Trump proxy was too tempting.
We have been in several arguments on the subject among friends: Does Gretzky owe Canada something after carrying its hockey burden for so long? Could he have worn a Team Canada jersey? Shouldn’t he have made a statement that he backs Canada in its showdown with Trump? For now 99 is 0 in his homeland.”
Even now, months later, the events of late February have an air of disbelief around them, a shift so dramatic and so impactful on the nation that many still shake their heads. Sure, hockey wasn’t the device that blew up Canada’s politics. But it was the fuse that created a crater in the country.
Bruce Dowbiggin @dowbboy is the editor of Not The Public Broadcaster A two-time winner of the Gemini Award as Canada’s top television sports broadcaster, his new book Deal With It: The Trades That Stunned The NHL And Changed hockey is now available on Amazon. Inexact Science: The Six Most Compelling Draft Years In NHL History, his previous book with his son Evan, was voted the seventh-best professional hockey book of all time by bookauthority.org . His 2004 book Money Players was voted sixth best on the same list, and is available via brucedowbigginbooks.ca.

From the Fraser Institute
By Matthew Lau
It’s now more than four years since the federal Liberal government pledged $30 billion in spending over five years for $10-per-day national child care, and more than three years since Ontario’s Progressive Conservative government signed a $13.2 billion deal with the federal government to deliver this child-care plan.
Not surprisingly, with massive government funding came massive government control. While demand for child care has increased due to the government subsidies and lower out-of-pocket costs for parents, the plan significantly restricts how child-care centres operate (including what items participating centres may purchase), and crucially, caps the proportion of government funds available to private for-profit providers.
What have families and taxpayers got for this enormous government effort? Widespread child-care shortages across Ontario.
For example, according to the City of Ottawa, the number of children (aged 0 to 5 years) on child-care waitlists has ballooned by more than 300 per cent since 2019, there are significant disparities in affordable child-care access “with nearly half of neighbourhoods underserved, and limited access in suburban and rural areas,” and families face “significantly higher” costs for before-and-after-school care for school-age children.
In addition, Ottawa families find the system “complex and difficult to navigate” and “fewer child care options exist for children with special needs.” And while 42 per cent of surveyed parents need flexible child care (weekends, evenings, part-time care), only one per cent of child-care centres offer these flexible options. These are clearly not encouraging statistics, and show that a government-knows-best approach does not properly anticipate the diverse needs of diverse families.
Moreover, according to the Peel Region’s 2025 pre-budget submission to the federal government (essentially, a list of asks and recommendations), it “has maximized its for-profit allocation, leaving 1,460 for-profit spaces on a waitlist.” In other words, families can’t access $10-per-day child care—the central promise of the plan—because the government has capped the number of for-profit centres.
Similarly, according to Halton Region’s pre-budget submission to the provincial government, “no additional families can be supported with affordable child care” because, under current provincial rules, government funding can only be used to reduce child-care fees for families already in the program.
And according to a March 2025 Oxford County report, the municipality is experiencing a shortage of child-care staff and access challenges for low-income families and children with special needs. The report includes a grim bureaucratic predication that “provincial expansion targets do not reflect anticipated child care demand.”
Child-care access is also a problem provincewide. In Stratford, which has a population of roughly 33,000, the municipal government reports that more than 1,000 children are on a child-care waitlist. Similarly in Port Colborne (population 20,000), the city’s chief administrative officer told city council in April 2025 there were almost 500 children on daycare waitlists at the beginning of the school term. As of the end of last year, Guelph and Wellington County reportedly had a total of 2,569 full-day child-care spaces for children up to age four, versus a waitlist of 4,559 children—in other words, nearly two times as many children on a waitlist compared to the number of child-care spaces.
More examples. In Prince Edward County, population around 26,000, there are more than 400 children waitlisted for licensed daycare. In Kawartha Lakes and Haliburton County, the child-care waitlist is about 1,500 children long and the average wait time is four years. And in St. Mary’s, there are more than 600 children waitlisted for child care, but in recent years town staff have only been able to move 25 to 30 children off the wait list annually.
The numbers speak for themselves. Massive government spending and control over child care has created havoc for Ontario families and made child-care access worse. This cannot be a surprise. Quebec’s child-care system has been largely government controlled for decades, with poor results. Why would Ontario be any different? And how long will Premier Ford allow this debacle to continue before he asks the new prime minister to rethink the child-care policy of his predecessor?

Matthew Lau
Adjunct Scholar, Fraser Institute


What Connor Should Say To Oilers: It’s Not You. It’s Me.

Ontario man launches new challenge against province’s latest attempt to ban free expression on roadside billboards

The Passage of Bill C-5 Leaves the Conventional Energy Sector With as Many Questions as Answers
Federal fiscal anchor gives appearance of prudence, fails to back it up
-
COVID-1911 hours ago
Ontario man launches new challenge against province’s latest attempt to ban free expression on roadside billboards
-
 Energy18 hours ago
This Canada Day, Celebrate Energy Renewal
-
 Business2 days ago
While China Hacks Canada, B.C. Sends Them a Billion-Dollar Ship Building Contract
-
 Alberta1 day ago
So Alberta, what’s next?
-
 Alberta9 hours ago
Alberta Next Takes A Look At Alberta Provincial Police Force
-
 Bjorn Lomborg2 days ago
The Physics Behind The Spanish Blackout
-
 Alberta11 hours ago
Canadian Oil Sands Production Expected to Reach All-time Highs this Year Despite Lower Oil Prices
-
 Business14 hours ago
Potential For Abuse Embedded In Bill C-5