Energy
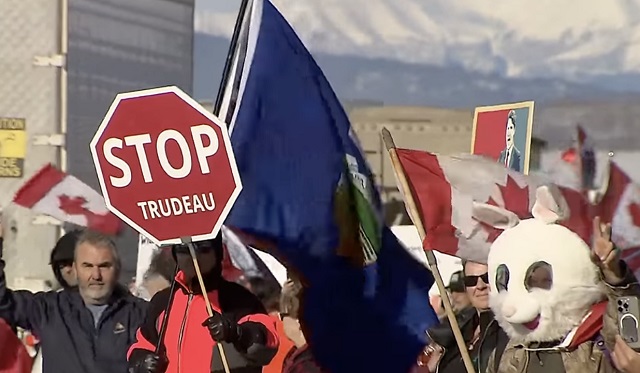
Thousands of Canadians gather nationwide to protest Trudeau’s carbon tax
From LifeSiteNews
“Continue the peaceful event until goals are achieved, regardless of duration,” the groups mission statement directed.
Canadians across the country have launched Freedom Convoy-styled protests against Trudeau’s carbon tax hike.
On April 1, thousands of Canadians took to the streets to protest Prime Minister Justin Trudeau’s 23 percent carbon tax increase on the same day, with some blocking major highways in Maritime and Western provinces.
“This is a peaceful event aimed at uniting Canadians for a common cause & We will be holding the line indefinitely until our mission objective is achieved,” Nationwide Protest Against Carbon Tax, the group organizing the protest, wrote on its website.
“Join us in this steadfast commitment to ensure our voices are heard and our goals are realized,” it continued. “Together, we stand for change.”
The protest aimed to cause interprovincial border strikes on highways across Canada. The guidelines requested that protestors keep at least one center lane open for traffic.
“Continue the peaceful event until goals are achieved, regardless of duration,” the groups mission statement directed.
Therefore, beginning the morning of April 1, the Trans-Canada highway was partially blocked in certain areas as thousands of Canadians came out in protest of Trudeau’s carbon tax.
At the Nova Scotia–New Brunswick border, hundreds of cars and trucks lined up along the highway, causing Royal Canadians Mounted Police (RCMP) to eventually close the road and divert traffic to a secondary road.
Similarly, Calgary RCMP redirected traffic from the Trans-Canada highway after about 400 protesters used traffic pylons to block one way of traffic heading west towards Banff.
WATCH: Here’s a look at carbon tax protesters lining Highway 1. Vehicles are slowing down and many are honking in support. #CarbonTaxProtest pic.twitter.com/z8YshQ6axA
— Rachel Emmanuel (@Emmanuel_Rach) April 1, 2024
“We’re going to be camping out. There’s no departure date, let’s put it that way,” organizer Elliot McDavid told independent media outlet True North at the Calgary protest.
WATCH: “There’s no departure date, let’s put it that way.”
Organizer Elliot McDavid says the group is waiting for traffic control signs to block the highway. He also says there’s no scheduled end date for the protest.#CarbonTaxProtest pic.twitter.com/ok68HOi5pZ
— Rachel Emmanuel (@Emmanuel_Rach) April 1, 2024
Another protest of around 500, this one along the Alberta-Saskatchewan border, included a pancake breakfast, coffee, and a warming shack, according to True North.
Additionally, protesters gathered on Parliament Hill, in downtown Ottawa, chanting “Freedom” and waving Canadians flag.
Anti Carbon Tax protesters chant “Freedom” on Parliament Hill. pic.twitter.com/0LMF0WAOZM
— Élie Cantin-Nantel (@elie_mcn) April 1, 2024
Many compared the protests to the 2022 Freedom Convoy, which featured thousands of Canadians camping out in downtown Ottawa to call for an end to COVID regulations and vaccine mandates.
The protest come after Trudeau increased the carbon tax despite seven out of 10 provincial premiers and 70 percent of Canadians pleading with him to halt his plan.
Trudeau’s carbon tax, framed as a way to reduce carbon emissions, has cost Canadian households hundreds of dollars annually despite rebates.
The increased costs are only expected to rise, as a recent report revealed that a carbon tax of more than $350 per tonne is needed to reach Trudeau’s net-zero goals by 2050.
Currently, Canadians living in provinces under the federal carbon pricing scheme pay $80 per tonne, but the Trudeau government has a goal of $170 per tonne by 2030.
However, despite appeals from politicians and Canadians alike, Trudeau remains determined to increase the carbon tax regardless of its effects on Canadians’ lives.
The Trudeau government’s current environmental goals – which are in lockstep with the United Nations’ 2030 Agenda for Sustainable Development – include phasing out coal-fired power plants, reducing fertilizer usage, and curbing natural gas use over the coming decades.
The reduction and eventual elimination of so-called “fossil fuels” and a transition to unreliable “green” energy has also been pushed by the World Economic Forum, the globalist group behind the socialist “Great Reset” agenda in which Trudeau and some of his cabinet are involved.
Alberta
Official statement from Premier Danielle Smith and Energy Minister Brian Jean on the start-up of the Trans Mountain Pipeline
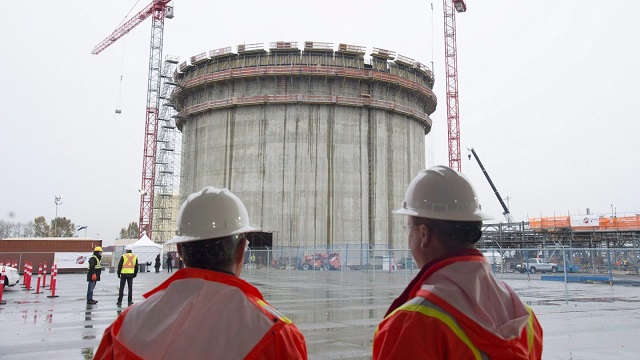
Construction workers look on at the FortisBC Tilbury LNG expansion project in Delta, B.C., Monday, Nov. 16, 2015. CP Images photo
From the Canadian Energy Centre
Lower costs for natural gas, shipping and liquefaction give Canada an edge in the emerging global LNG market
Worldwide concerns about energy security have put a renewed focus on the international liquefied natural gas (LNG) industry. The global demand for LNG is expected to increase over the next few decades.
Global demand growth will be driven primarily by Asian markets where the need for LNG is expected to increase from 277 million tonnes (MT) in 2025 to 509 MT by 2050 (see Figure 1). By 2050 the demand for LNG in Europe will be 83 MT and in Africa 20 MT. In South America too, demand will increase – from 13 MT in 2025 to 31 MT in 2050.

Source: Derived from Rystad Energy, Gas and LNG Markets Solution.
In North America (Canada, Mexico, and United States) a number of LNG projects that are either under construction or in the planning stages will benefit from the rise in global LNG demand.
North American LNG production is expected to grow from 112 MT in 2025 to over 255 MT by 2050 (see Figure 2). In Canada, the LNG projects under construction or in the planning stages include LNG Canada Phases 1 & 2, Woodfibre LNG, Cedar LNG, the Tilbury LNG expansion, and Ksi Lisims LNG. Canada’s LNG production is expected to grow from just 2 MT in 2025 to over 43 MT by 2050. In the United States production is projected to increase from 108 MT in 2025 to 210 MT in 2050.

Source: Derived from Rystad Energy, Gas and LNG Markets Solution.
This CEC Fact Sheet uses Rystad Energy’s Gas and LNG Markets Solution¹ to benchmark the cost competitiveness of LNG projects that are under construction and proposed in Canada compared to other LNG projects under construction and planned elsewhere in North America. (Note that the content of this report does not represent the views of Rystad Energy.)
The LNG cost competitiveness benchmarking analysis used the following performance metrics:
- LNG plant free-on-board (FOB) cost break-even;
- Total LNG plant cost (for delivery into Asia and Europe).
The objective of this LNG cost competitiveness benchmarking is to compare the competitiveness of Canadian LNG projects against those of major competitors in the United States and Mexico. The selection of other North American LNG facilities for the benchmark comparison with Canadian LNG projects (LNG Canada, the Tilbury LNG Expansion, Woodfibre LNG, Cedar LNG, and Ksi Lisims LNG) is based on the rationale that virtually all Canadian LNG plants are under construction or in the planning stage and that they compare well with other North American LNG plants that are also under construction or are being planned between 2023 and 2050. Further, to assess the cost competitiveness of the various LNG projects more accurately, we chose only North American LNG facilities with sufficient economic data to enable such a comparison. We compared the cost competitiveness of LNG coming from these other North American projects with LNG coming from Canada that is intended to be delivered to markets in Asia and Europe.
1. Rystad Energy is an independent energy research company providing data, analytics, and consultancy services to clients around the globe. Its Gas and LNG Markets Solution provides an overview of LNG markets worldwide. The Solution covers the entire value chain associated with gas and LNG production, country and sector-level demand, and LNG trade flows, infrastructure, economics, costs, and contracts through 2050. It allows for the evaluation of the entire LNG market infrastructure, including future planned projects, as well as the benchmarking of costs for LNG projects (Rystad Energy, 2024).
Comparison of LNG project FOB cost break-even (full cycle)
Figure 3 provides a comparison of the free-on-board (FOB) cost break-even for LNG facilities under construction or being planned in North America. FOB break-even costs include upstream and midstream costs for LNG excluding transportation costs (shipping) as seen from the current year. Break-even prices assume a discount rate of 10 percent and represent the point at which the net present value for an LNG project over a 20- to 30-year period becomes positive, including the payment of capital and operating costs, inclusive of taxes.
Among the selected group of North American LNG projects are Canadian LNG projects with an FOB break-even at the lower end of the range (US$7.18 per thousand cubic feet (kcf)) to those at the higher end (US$8.64 per thousand cubic feet (kcf)).
LNG projects in the United States tend to settle in the middle of the pack, with FOB break-even between US$6.44 per kcf and US$8.37 per kcf.
Mexico LNG projects have the widest variation in costs among the selected group of projects, ranging from US$6.94 per kcf to US$9.44 per kcf (see Figure 3).

Source: Derived from Rystad Energy, Gas and LNG Markets Solution.
Total costs by project for LNG delivery to Asia and Europe
The total cost by LNG plant includes FOB cost break-even, transportation costs, and the regasification tariff. Figure 4 compares total project costs for LNG destined for Asia from selected North American LNG facilities.
Canadian LNG projects are very cost competitive, and those with Asia as their intended market tend to cluster at the lower end of the scale. The costs vary by project, but range between US$8.10 per kcf and US$9.56 per kcf, making Canadian LNG projects among the lowest cost projects in North America.
The costs for Mexico’s LNG projects with Asia as the intended destination for their product tend to cluster in the middle of the pack. Costs among U.S. LNG facilities that plan to send their product to Asia tend to sit at the higher end of the scale, at between US$8.90 and US$10.80 per kcf.

Source: Derived from Rystad Energy, Gas and LNG Markets Solution.
Figure 5 compares total project costs for LNG to be delivered to Europe from select North American LNG facilities.
Costs from U.S. LNG facilities show the widest variation for this market at between US$7.48 per kcf and US$9.42 per kcf, but the majority of U.S. LNG facilities tend to cluster at the lower end of the cost scale, between US$7.48 per kcf and US$8.61 per kcf (see Figure 5).
Canadian projects that intend to deliver LNG to Europe show a variety of costs that tend to cluster at the middle to higher end of the spectrum, ranging from US$9.60 per kcf to and US$11.06 per kcf.
The costs of Mexico’s projects that are aimed at delivering LNG to Europe tend to cluster in the middle of the spectrum (US$9.11 per kcf to US$10.61 per kcf).

Source: Derived from Rystad Energy, Gas and LNG Markets Solution.
Conclusion
LNG markets are complex. Each project is unique and presents its own challenges. The future of Canadian LNG projects depends upon the overall demand and supply in the global LNG market. As the demand for LNG increases in the next decades, the world will be searching for energy security.
The lower liquefaction and shipping costs coupled with the lower cost of the natural gas itself in Western Canada translate into lower prices for Canadian LNG, particularly that destined for Asian markets. Those advantages will help make Canadian LNG very competitive and attractive to markets worldwide.


Japanese study finds ‘significant increases’ in cancer deaths after third mRNA COVID doses
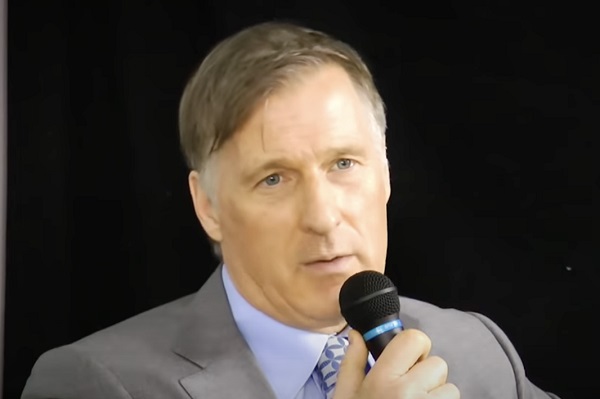
Maxime Bernier warns Canadians of Trudeau’s plan to implement WEF global tax regime
WHO Official Admits the Truth About Passports

A Coup Without Firing a Shot
-
 Education21 hours ago
Support a young reader through the Tim Hortons Smile Cookie campaign
-
 Alberta2 days ago
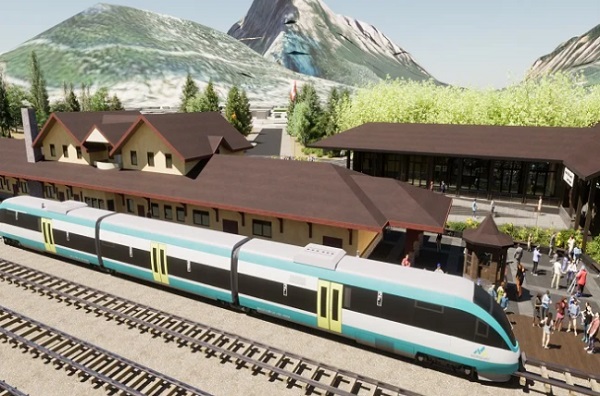
Alberta’s vision for passenger rail
-
 John Stossel2 days ago
Why Biden’s Just Wrong: NO ONE “Knows How to Make Government Work.”
-
 Education2 days ago
Rebels earn Jim Donlevy Memorial Trophy as WHL Scholastic Team of the Year
-
 RCMP2 days ago
Red Deer RCMP arrest two individuals following ramming of police vehicle
-
 Alberta2 days ago
Three Calgary massage parlours linked to human trafficking investigation
-
 COVID-192 days ago
States move to oppose WHO’s ‘pandemic treaty,’ assert states’ rights
-
 Business22 hours ago
WEF panelist suggests COVID response accustomed people to the idea of CBDCs