Energy
Courts expose Ottawa’s green overreach

From the Fraser Institute
It has been a rough autumn for the Trudeau government. First, the Supreme Court of Canada struck down significant parts of the federal Impact Assessment Act (also known as Bill C-69), ruling the act to be broadly unconstitutional and finding that the government had made the review process ambiguous and overly broad while intruding on provincial authority. Then last week, Canada’s Federal Court struck down the Trudeau government’s ban on single-use plastics finding the government’s classification of “plastic manufactured items” (PMI) as toxic materials under the Canadian Environmental Protection Act (CEPA) to be unsound.
And yet, the Trudeau government has already signalled the next stage in its crusade against plastics. Having banned a limited set of plastics-of-convenience (straws, cutlery, etc.), it plans to ban plastic films and containers used up and down the food chain to keep foods isolated from contamination, protected from pests and destructive oxidation, and cold, which is critical to preventing microbial contamination and spoilage.
One can hope that this second court strike will lead the government to reconsider and preferably scrap its entire “Zero Plastic Waste by 2030” plan, which is deeply flawed. As I showed in a 2022 study published by the Fraser Institute, Canada does not have a significant plastic waste problem. Less than 1 per cent of plastics used in Canada end up as waste in the environment while 99 per cent is safely buried in landfills, recycled or incinerated. Canada is not a measurable part of the world’s plastic pollution problem.
Moreover, the government’s own analysis suggests that pursuing this war on plastics will ultimately lead to greater waste of alternative materials, raising concerns among environmentalists. Even if the Trudeau government’s “Zero Plastic” plan were to work, it would produce an undetectable reduction in the growth of global plastic pollution of three thousandths of one per cent. Remember, this is by the government’s own admission.
And even that small reduction in environmental harm will likely be offset by increased environmental harms due to replacements for the plastic products banned by the government. Again, per the government’s own analysis, “Zero Plastic” regulations are expected to increase the waste generated from substitutes by almost 300,000 tonnes in 2024 and by around 2.9 million tonnes over the full life of the plan (2023 to 2032), mainly driven by paper substitutes.
Bottom line—the Trudeau government’s anti-plastic regulations would keep about 1.5 million tonnes of plastics from entering the waste stream over the course of the program, but would add about 2.9 million tonnes of other materials to the waste stream from the use of substitutes. And increase the costs of waste management in Canada.
The government should take a hint from the two recent court rulings—which found two of its signature environmental initiatives unconstitutional, unreasonable and ill-founded—and take both the Impact Assessment Act and the “Zero Plastic Waste by 2030” plan back to the drawing board. Of course, given federal Environment Minister Steven Guilbeault’s reaction to the Supreme Court ruling—basically, the government doesn’t think it’s doing anything wrong and does not intend to change course—this government is unlikely to make serious efforts at compliance with the new court ruling on plastics. Serious reform will likely have to wait for a change in government.
Author:

Alberta
Official statement from Premier Danielle Smith and Energy Minister Brian Jean on the start-up of the Trans Mountain Pipeline
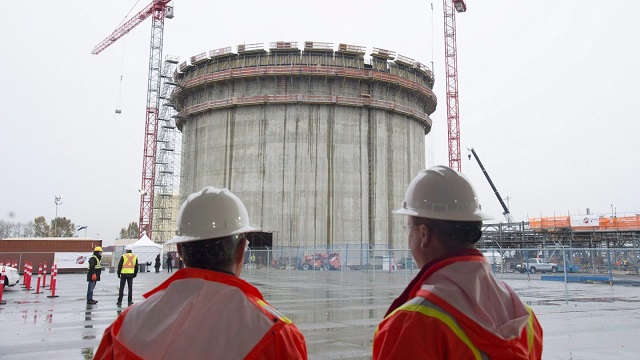
Construction workers look on at the FortisBC Tilbury LNG expansion project in Delta, B.C., Monday, Nov. 16, 2015. CP Images photo
From the Canadian Energy Centre
Lower costs for natural gas, shipping and liquefaction give Canada an edge in the emerging global LNG market
Worldwide concerns about energy security have put a renewed focus on the international liquefied natural gas (LNG) industry. The global demand for LNG is expected to increase over the next few decades.
Global demand growth will be driven primarily by Asian markets where the need for LNG is expected to increase from 277 million tonnes (MT) in 2025 to 509 MT by 2050 (see Figure 1). By 2050 the demand for LNG in Europe will be 83 MT and in Africa 20 MT. In South America too, demand will increase – from 13 MT in 2025 to 31 MT in 2050.

Source: Derived from Rystad Energy, Gas and LNG Markets Solution.
In North America (Canada, Mexico, and United States) a number of LNG projects that are either under construction or in the planning stages will benefit from the rise in global LNG demand.
North American LNG production is expected to grow from 112 MT in 2025 to over 255 MT by 2050 (see Figure 2). In Canada, the LNG projects under construction or in the planning stages include LNG Canada Phases 1 & 2, Woodfibre LNG, Cedar LNG, the Tilbury LNG expansion, and Ksi Lisims LNG. Canada’s LNG production is expected to grow from just 2 MT in 2025 to over 43 MT by 2050. In the United States production is projected to increase from 108 MT in 2025 to 210 MT in 2050.

Source: Derived from Rystad Energy, Gas and LNG Markets Solution.
This CEC Fact Sheet uses Rystad Energy’s Gas and LNG Markets Solution¹ to benchmark the cost competitiveness of LNG projects that are under construction and proposed in Canada compared to other LNG projects under construction and planned elsewhere in North America. (Note that the content of this report does not represent the views of Rystad Energy.)
The LNG cost competitiveness benchmarking analysis used the following performance metrics:
- LNG plant free-on-board (FOB) cost break-even;
- Total LNG plant cost (for delivery into Asia and Europe).
The objective of this LNG cost competitiveness benchmarking is to compare the competitiveness of Canadian LNG projects against those of major competitors in the United States and Mexico. The selection of other North American LNG facilities for the benchmark comparison with Canadian LNG projects (LNG Canada, the Tilbury LNG Expansion, Woodfibre LNG, Cedar LNG, and Ksi Lisims LNG) is based on the rationale that virtually all Canadian LNG plants are under construction or in the planning stage and that they compare well with other North American LNG plants that are also under construction or are being planned between 2023 and 2050. Further, to assess the cost competitiveness of the various LNG projects more accurately, we chose only North American LNG facilities with sufficient economic data to enable such a comparison. We compared the cost competitiveness of LNG coming from these other North American projects with LNG coming from Canada that is intended to be delivered to markets in Asia and Europe.
1. Rystad Energy is an independent energy research company providing data, analytics, and consultancy services to clients around the globe. Its Gas and LNG Markets Solution provides an overview of LNG markets worldwide. The Solution covers the entire value chain associated with gas and LNG production, country and sector-level demand, and LNG trade flows, infrastructure, economics, costs, and contracts through 2050. It allows for the evaluation of the entire LNG market infrastructure, including future planned projects, as well as the benchmarking of costs for LNG projects (Rystad Energy, 2024).
Comparison of LNG project FOB cost break-even (full cycle)
Figure 3 provides a comparison of the free-on-board (FOB) cost break-even for LNG facilities under construction or being planned in North America. FOB break-even costs include upstream and midstream costs for LNG excluding transportation costs (shipping) as seen from the current year. Break-even prices assume a discount rate of 10 percent and represent the point at which the net present value for an LNG project over a 20- to 30-year period becomes positive, including the payment of capital and operating costs, inclusive of taxes.
Among the selected group of North American LNG projects are Canadian LNG projects with an FOB break-even at the lower end of the range (US$7.18 per thousand cubic feet (kcf)) to those at the higher end (US$8.64 per thousand cubic feet (kcf)).
LNG projects in the United States tend to settle in the middle of the pack, with FOB break-even between US$6.44 per kcf and US$8.37 per kcf.
Mexico LNG projects have the widest variation in costs among the selected group of projects, ranging from US$6.94 per kcf to US$9.44 per kcf (see Figure 3).

Source: Derived from Rystad Energy, Gas and LNG Markets Solution.
Total costs by project for LNG delivery to Asia and Europe
The total cost by LNG plant includes FOB cost break-even, transportation costs, and the regasification tariff. Figure 4 compares total project costs for LNG destined for Asia from selected North American LNG facilities.
Canadian LNG projects are very cost competitive, and those with Asia as their intended market tend to cluster at the lower end of the scale. The costs vary by project, but range between US$8.10 per kcf and US$9.56 per kcf, making Canadian LNG projects among the lowest cost projects in North America.
The costs for Mexico’s LNG projects with Asia as the intended destination for their product tend to cluster in the middle of the pack. Costs among U.S. LNG facilities that plan to send their product to Asia tend to sit at the higher end of the scale, at between US$8.90 and US$10.80 per kcf.

Source: Derived from Rystad Energy, Gas and LNG Markets Solution.
Figure 5 compares total project costs for LNG to be delivered to Europe from select North American LNG facilities.
Costs from U.S. LNG facilities show the widest variation for this market at between US$7.48 per kcf and US$9.42 per kcf, but the majority of U.S. LNG facilities tend to cluster at the lower end of the cost scale, between US$7.48 per kcf and US$8.61 per kcf (see Figure 5).
Canadian projects that intend to deliver LNG to Europe show a variety of costs that tend to cluster at the middle to higher end of the spectrum, ranging from US$9.60 per kcf to and US$11.06 per kcf.
The costs of Mexico’s projects that are aimed at delivering LNG to Europe tend to cluster in the middle of the spectrum (US$9.11 per kcf to US$10.61 per kcf).

Source: Derived from Rystad Energy, Gas and LNG Markets Solution.
Conclusion
LNG markets are complex. Each project is unique and presents its own challenges. The future of Canadian LNG projects depends upon the overall demand and supply in the global LNG market. As the demand for LNG increases in the next decades, the world will be searching for energy security.
The lower liquefaction and shipping costs coupled with the lower cost of the natural gas itself in Western Canada translate into lower prices for Canadian LNG, particularly that destined for Asian markets. Those advantages will help make Canadian LNG very competitive and attractive to markets worldwide.


Japanese study finds ‘significant increases’ in cancer deaths after third mRNA COVID doses
WHO Official Admits the Truth About Passports

Maxime Bernier warns Canadians of Trudeau’s plan to implement WEF global tax regime

A Coup Without Firing a Shot
-
 Education17 hours ago
Support a young reader through the Tim Hortons Smile Cookie campaign
-
 Alberta2 days ago
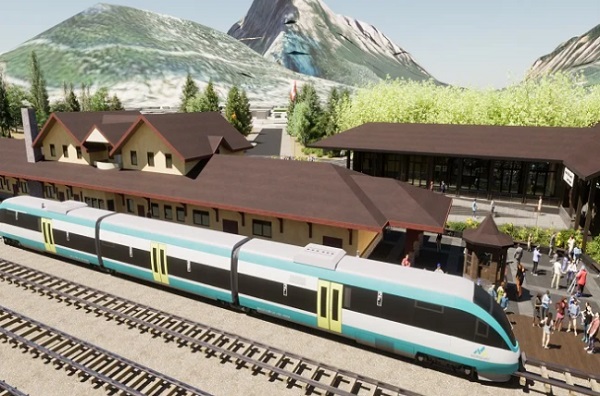
Alberta’s vision for passenger rail
-
 RCMP2 days ago
Red Deer RCMP arrest two individuals following ramming of police vehicle
-
 John Stossel2 days ago
Why Biden’s Just Wrong: NO ONE “Knows How to Make Government Work.”
-
 Education2 days ago
Rebels earn Jim Donlevy Memorial Trophy as WHL Scholastic Team of the Year
-
 Alberta2 days ago
Three Calgary massage parlours linked to human trafficking investigation
-
 COVID-192 days ago
States move to oppose WHO’s ‘pandemic treaty,’ assert states’ rights
-
 Business17 hours ago
WEF panelist suggests COVID response accustomed people to the idea of CBDCs