Canadian Energy Centre
Reality check: Global emissions from coal plants
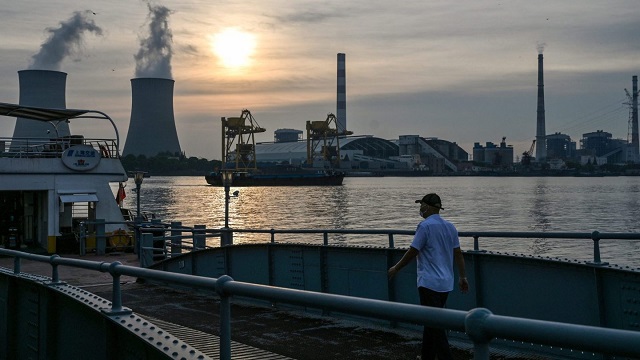


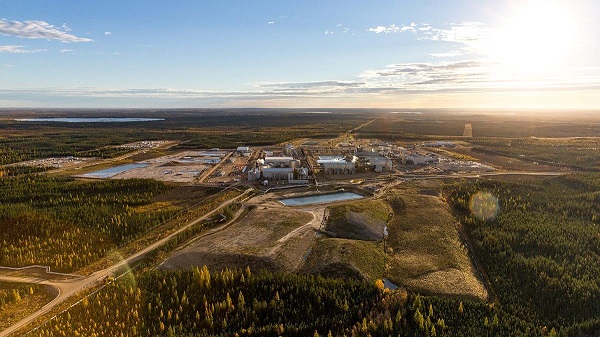
A man walks towards a ferry as the Wujing coal-electricity power station is seen across the Huangpu River in the Minhang district of Shanghai. Getty Images photo
From the Canadian Energy Centre
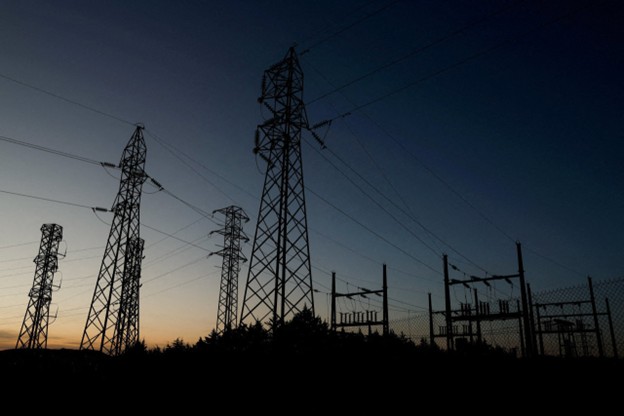
Coal remains the primary fuel for global electricity generation, particularly in Asian countries
High energy prices, inflation, war, and the ongoing economic recovery from the pandemic has highlighted the general worldwide demand for electricity, particularly in Asia and Europe. The growing demand for electricity on these two continents has led some electricity producing plants to rely increasingly heavily on coal as a power source.
The electricity sector accounts for 34 per cent of the world’s energy-related carbon dioxide (CO2) emissions. In this Fact Sheet, we detail recent trends in electricity production and demand across the globe as well as CO2 emissions from the electricity sector worldwide.
Carbon dioxide emissions from the world’s top ten emitters between 2000 and 2022
A total of 38.2 gigatonnes (Gt) of energy-related CO2 was emitted globally in 2022, an increase of 53 per cent from 2000. However, the increase is not consistent for all countries; between 2000 and 2023, CO2 emissions trends diverged. Emissions from China, India, and Indonesia more than doubled in the last two decades, whereas emissions for other countries remained relatively consistent or even declined.
In 2022, Canada’s total energy-related CO2 emissions were 0.62 Gt, or 1.6 per cent of the global total. That compares to emissions of 0.64 Gt in South Korea, 1.09 Gt in Japan, 2.8 Gt in India, 5.0 Gt in the United States, and 13.0 Gt in China (see Figure 1).

Sources: IEA World Energy Statistics database and Enerdata
Demand for electricity and sources of emissions
Global domestic electricity consumption increased from 13,188 terawatt-hours (TWh) in 2000 to 25,681 TWh in 2022 and estimates are that global demand for electricity will rise to 35,000 TWh by 2040.¹
That is a jump of 94 per cent, or 12,492 TWh, between 2000 and 2022. During the same period, electricity consumption in Asia rose a whopping 280 per cent. In Africa the demand for electricity increased by 90 per cent (see Figure 2). Coal remains the world’s largest source of fuel for electricity generation, with approximately 10,317 terawatt-hours of electricity generated by coal-fired plants in 2022 (see Figure 3).
1. The IEA’s Electricity Market Report 2022 states that nearly all of the increase is attributable to growing electricity consumption in developing countries across southeast Asia and Africa.

Sources: IEA World Energy Statistics database and Enerdata

Sources: IEA World Energy Statistics database and Enerdata
In recent years, electricity generated from the combustion of coal declined in Canada, the United States, Europe, and Africa. However, electricity generated from coal combustion has continued to grow in China, India, and other parts of Asia.
Between 2000 and 2022, the share of coal-powered electricity generation in Asia increased from 49.8 to 56. 3 per cent, while in Canada it decreased from 19.4 per cent to less than 5 per cent.

Sources: IEA World Energy Statistics database and Enerdata
Source of emissions in the electricity sector
The electricity sector accounts for 34 per cent of the carbon dioxide emitted across the world. The sector emitted 13.05 gigatonnes of CO2 in 2022, an increase of 5.01 Gt from 2000. In Asia, between 2000 and 2022, CO2 emissions from the electricity sector increased from 2.5 Gt to 8.3 Gt and the sector’s share of carbon dioxide (CO2) emissions increased from just over 32 per cent to well over 40 per cent (see Figure 5).

Sources: IEA World Energy Statistics database and Enerdata
Coal burned to generate electricity accounts for the majority of the CO2 emitted in power generation. In 2022, coal-fired electricity\ generation accounted for 9.89 Gt, or nearly 76 per cent of the worldwide CO2 emissions from the electricity sector. The share was even higher in Asia where 92 per cent of emissions from the electricity sector come from coal combustion. Asian coal-fired plants accounted for 7.62 Gt of the total 8.26 Gt of emissions from the sector on that continent (see Figure 6).

Sources: IEA World Energy Statistics database and Enerdata
Conclusion
The global electricity sector, and particularly the sector in Asia, is a major source of CO2 emissions. Relative to Canada’s existing carbon emissions, emissions from the coal-fired power plants worldwide will make any reductions in Canada’s carbon emissions and resulting job losses, higher taxes, and higher costs for consumers and businesses—meaningless.
As 56 per cent of the electricity in Asia is generated by coal-fired plants, a transition from coal- to gas-fired electricity generation in the region could lead to significant reductions in CO2 emissions, reducing emissions by 50 per cent on average. The corollary is that there is a potential market in Asia for natural gas extracted in and exported from Canada. Canada has an opportunity to play a useful and meaningful role in reducing CO2 emissions from the electricity sector by encouraging and contributing to the global natural gas market.
Notes
This CEC Fact Sheet was compiled by Ven Venkatachalam at the Canadian Energy Centre (www.canadianenergycentre.ca). The author and the Canadian Energy Centre would like to thank and acknowledge the assistance of an anonymous reviewer in reviewing the data and research for this Fact Sheet.
References (live as of November 2, 2023)
Canadian Energy Centre (November 7, 2022), Canadian LNG has massive opportunity in Asia: report <https://tinyurl.com/2p9525j6>; Enerdata (2022), Power Plant Tracker database <https://bit.ly/3xfgOdF>; IEA (2022), Electricity Market Report – January 2022 <https://bit.ly/3M0723j> IEA (Undated), World Energy Statistics Database <https://tinyurl.com/ytz789m4>
Alberta
The permanent CO2 storage site at the end of the Alberta Carbon Trunk Line is just getting started
Wells at the Clive carbon capture, utilization and storage project near Red Deer, Alta. Photo courtesy Enhance Energy
From the Canadian Energy Centre
Inside Clive, a model for reducing emissions while adding value in Alberta
It’s a bright spring day on a stretch of rolling farmland just northeast of Red Deer. It’s quiet, but for the wind rushing through the grass and the soft crunch of gravel underfoot.
The unassuming wellheads spaced widely across the landscape give little hint of the significance of what is happening underground.
In just five years, this site has locked away more than 6.5 million tonnes of CO₂ — equivalent to the annual emissions of about 1.5 million cars — stored nearly four CN Towers deep beneath the surface.
The CO₂ injection has not only reduced emissions but also breathed life into an oilfield that was heading for abandonment, generating jobs, economic activity and government revenue that would have otherwise been lost.
This is Clive, the endpoint of one of Canada’s largest carbon capture, utilization and storage (CCUS) projects. And it’s just getting started.
Rooted in Alberta’s first oil boom
Clive’s history ties to Alberta’s first oil boom, with the field discovered in 1952 along the same geological trend as the legendary 1947 Leduc No. 1 gusher near Edmonton.
“The Clive field was discovered in the 1950s as really a follow-up to Leduc No. 1. This is, call it, Leduc No. 4,” said Chris Kupchenko, president of Enhance Energy, which now operates the Clive field.
Over the last 70 years Clive has produced about 70 million barrels of the site’s 130 million barrels of original oil in place, leaving enough energy behind to fuel six million gasoline-powered vehicles for one year.
“By the late 1990s and early 2000s, production had gone almost to zero,” said Candice Paton, Enhance’s vice-president of corporate affairs.
“There was resource left in the reservoir, but it would have been uneconomic to recover it.”

Facilities at the Clive project. Photo courtesy Enhance Energy
Gearing up for CO2
Calgary-based Enhance bought Clive in 2013 and kept it running despite high operating costs because of a major CO2 opportunity the company was developing on the horizon.
In 2008, Enhance and North West Redwater Partnership had launched development of the Alberta Carbon Trunk Line (ACTL), one of the world’s largest CO2 transportation systems.
Wolf Midstream joined the project in 2018 as the pipeline’s owner and operator.
Completed in 2020, the groundbreaking $1.2 billion project — supported by the governments of Canada and Alberta — connects carbon captured at industrial sites near Edmonton to the Clive facility.
“With CO2 we’re able to revitalize some of these fields, continue to produce some of the resource that was left behind and permanently store CO2 emissions,” Paton said.

Map of the Alberta Carbon Trunk Line courtesy of Wolf Midstream
An oversized pipeline on purpose
Each year, about 1.6 million tonnes of CO2 captured at the NWR Sturgeon Refinery and Nutrien Redwater fertilizer facility near Fort Saskatchewan travels down the trunk line to Clive.
In a unique twist, that is only about 10 per cent of the pipeline’s available space. The project partners intentionally built it with room to grow.
“We have a lot of excess capacity. The vision behind the pipe was, let’s remove barriers for the future,” Kupchenko said.
The Alberta government-supported goal was to expand CCS in the province, said James Fann, CEO of the Regina-based International CCS Knowledge Centre.
“They did it on purpose. The size of the infrastructure project creates the opportunity for other emitters to build capture projects along the way,” he said.

CO2 captured at the Sturgeon Refinery near Edmonton is transported by the Alberta Carbon Trunk Line to the Clive project. Photo courtesy North West Redwater Partnership
Extending the value of aging assets
Building more CCUS projects like Clive that incorporate enhanced oil recovery (EOR) is a model for extending the economic value of aging oil and gas fields in Alberta, Kupchenko said.
“EOR can be thought of as redeveloping real estate,” he said.
“Take an inner-city lot with a 700-square-foot house on it. The bad thing is there’s a 100-year-old house that has to be torn down. But the great thing is there’s a road to it. There’s power to it, there’s a sewer connection, there’s water, there’s all the things.
“That’s what this is. We’re redeveloping a field that was discovered 70 years ago and has at least 30 more years of life.”
The 180 existing wellbores are also all assets, Kupchenko said.
“They may not all be producing oil or injecting CO2, but every one of them is used. They are our eyes into the reservoir.”

CO2 injection well at the Clive carbon capture, utilization and storage project. Photo for the Canadian Energy Centre
Alberta’s ‘beautiful’ CCUS geology
The existing wells are an important part of measurement, monitoring and verification (MMV) at Clive.
The Alberta Energy Regulator requires CCUS projects to implement a comprehensive MMV program to assess storage performance and demonstrate the long-term safety and security of CO₂.
Katherine Romanak, a subsurface CCUS specialist at the University of Texas at Austin, said that her nearly 20 years of global research indicate the process is safe.
“There’s never been a leak of CO2 from a storage site,” she said.
Alberta’s geology is particularly suitable for CCUS, with permanent storage potential estimated at more than 100 billion tonnes.
“The geology is beautiful,” Romanak said.
“It’s the thickest reservoir rocks you’ve ever seen. It’s really good injectivity, porosity and permeability, and the confining layers are crazy thick.”

Suitability of global regions for CO2 storage. Courtesy Global CCS Institute
CO2-EOR gaining prominence
The extra capacity on the ACTL pipeline offers a key opportunity to capitalize on storage potential while addressing aging oil and gas fields, according to the Alberta government’s Mature Asset Strategy, released earlier this year.
The report says expanding CCUS to EOR could attract investment, cut emissions and encourage producers to reinvest in existing properties — instead of abandoning them.
However, this opportunity is limited by federal policy.
Ottawa’s CCUS Investment Tax Credit, which became available in June 2024, does not apply to EOR projects.
“Often people will equate EOR with a project that doesn’t store CO2 permanently,” Kupchenko said.
“We like to always make sure that people understand that every ton of CO2 that enters this project is permanently sequestered. And we take great effort into storing that CO2.”
The International Energy Forum — representing energy ministers from nearly 70 countries including Canada, the U.S., China, India, Norway, and Saudi Arabia — says CO₂-based EOR is gaining prominence as a carbon sequestration tool.
The technology can “transform a traditional oil recovery method into a key pillar of energy security and climate strategy,” according to a June 2025 IEF report.

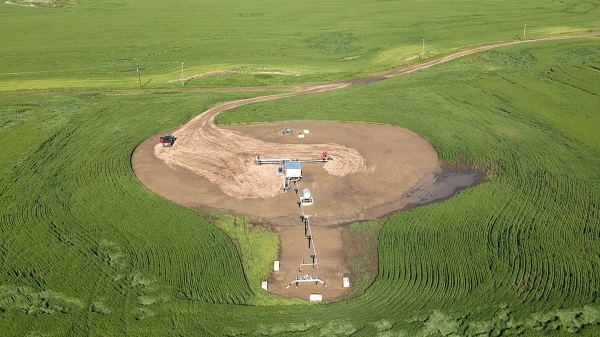
Drone view of the Clive project. Photo courtesy Enhance Energy
Tapping into more opportunity
In Central Alberta, Enhance Energy is advancing a new permanent CO2 storage project called Origins that is designed to revitalize additional aging oil and gas fields while reducing emissions, using the ACTL pipeline.
“Origins is a hub that’s going to enable larger scale EOR development,” Kupchenko said.
“There’s at least 10 times more oil in place in this area.”
Meanwhile, Wolf Midstream is extending the pipeline further into the Edmonton region to transport more CO2 captured from additional industrial facilities.
Canadian Energy Centre
Cross-Canada economic benefits of the proposed Northern Gateway Pipeline project
From the Canadian Energy Centre
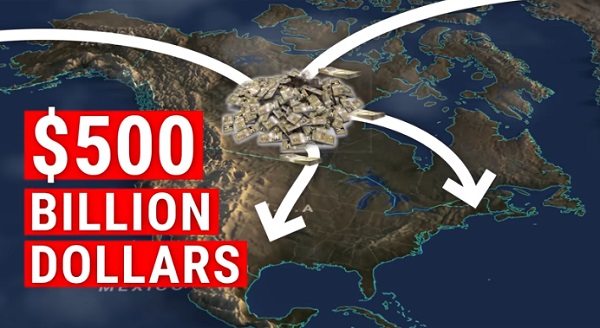
Billions in government revenue and thousands of jobs across provinces
Announced in 2006, the Northern Gateway project would have built twin pipelines between Bruderheim, Alta. and a marine terminal at Kitimat, B.C.
One pipeline would export 525,000 barrels per day of heavy oil from Alberta to tidewater markets. The other would import 193,000 barrels per day of condensate to Alberta to dilute heavy oil for pipeline transportation.
The project would have generated significant economic benefits across Canada.

The following projections are drawn from the report Public Interest Benefits of the Northern Gateway Project (Wright Mansell Research Ltd., July 2012), which was submitted as reply evidence during the regulatory process.
Financial figures have been adjusted to 2025 dollars using the Bank of Canada’s Inflation Calculator, with $1.00 in 2012 equivalent to $1.34 in 2025.
Total Government Revenue by Region
Between 2019 and 2048, a period encompassing both construction and operations, the Northern Gateway project was projected to generate the following total government revenues by region (direct, indirect and induced):

British Columbia
- Provincial government revenue: $11.5 billion
- Federal government revenue: $8.9 billion
- Total: $20.4 billion
Alberta
- Provincial government revenue: $49.4 billion
- Federal government revenue: $41.5 billion
- Total: $90.9 billion
Ontario
- Provincial government revenue: $1.7 billion
- Federal government revenue: $2.7 billion
- Total: $4.4 billion
Quebec
- Provincial government revenue: $746 million
- Federal government revenue: $541 million
- Total: $1.29 billion
Saskatchewan
- Provincial government revenue: $6.9 billion
- Federal government revenue: $4.4 billion
- Total: $11.3 billion
Other
- Provincial government revenue: $1.9 billion
- Federal government revenue: $1.4 billion
- Total: $3.3 billion
Canada
- Provincial government revenue: $72.1 billion
- Federal government revenue: $59.4 billion
- Total: $131.7 billion
Annual Government Revenue by Region
Over the period 2019 and 2048, the Northern Gateway project was projected to generate the following annual government revenues by region (direct, indirect and induced):

British Columbia
- Provincial government revenue: $340 million
- Federal government revenue: $261 million
- Total: $601 million per year
Alberta
- Provincial government revenue: $1.5 billion
- Federal government revenue: $1.2 billion
- Total: $2.7 billion per year
Ontario
- Provincial government revenue: $51 million
- Federal government revenue: $79 million
- Total: $130 million per year
Quebec
- Provincial government revenue: $21 million
- Federal government revenue: $16 million
- Total: $37 million per year
Saskatchewan
- Provincial government revenue: $204 million
- Federal government revenue: $129 million
- Total: $333 million per year
Other
- Provincial government revenue: $58 million
- Federal government revenue: $40 million
- Total: $98 million per year
Canada
- Provincial government revenue: $2.1 billion
- Federal government revenue: $1.7 billion
- Total: $3.8 billion per year
Employment by Region
Over the period 2019 to 2048, the Northern Gateway Pipeline was projected to generate the following direct, indirect and induced full-time equivalent (FTE) jobs by region:

British Columbia
- Annual average: 7,736
- Total over the period: 224,344
Alberta
- Annual average: 11,798
- Total over the period: 342,142
Ontario
- Annual average: 3,061
- Total over the period: 88,769
Quebec
- Annual average: 1,003
- Total over the period: 29,087
Saskatchewan
- Annual average: 2,127
- Total over the period: 61,683
Other
- Annual average: 953
- Total over the period: 27,637
Canada
- Annual average: 26,678
- Total over the period: 773,662


What Connor Should Say To Oilers: It’s Not You. It’s Me.
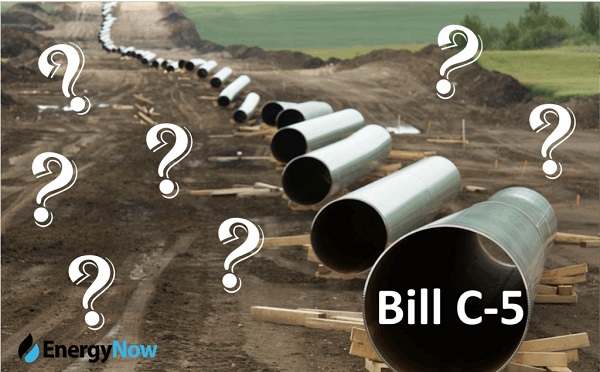
The Passage of Bill C-5 Leaves the Conventional Energy Sector With as Many Questions as Answers
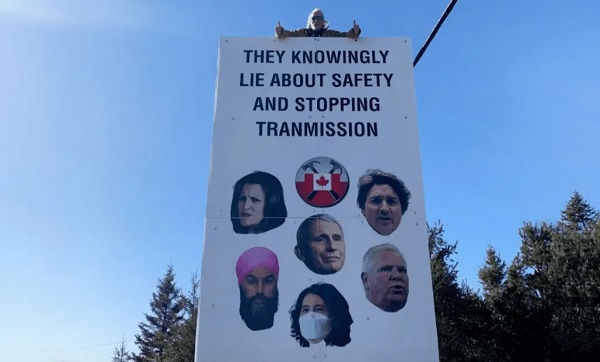
Ontario man launches new challenge against province’s latest attempt to ban free expression on roadside billboards

Federal fiscal anchor gives appearance of prudence, fails to back it up
-
COVID-199 hours ago
Ontario man launches new challenge against province’s latest attempt to ban free expression on roadside billboards
-
 Energy17 hours ago
This Canada Day, Celebrate Energy Renewal
-
 Business1 day ago
While China Hacks Canada, B.C. Sends Them a Billion-Dollar Ship Building Contract
-
 Alberta1 day ago
So Alberta, what’s next?
-
 Alberta8 hours ago
Alberta Next Takes A Look At Alberta Provincial Police Force
-
 Bjorn Lomborg1 day ago
The Physics Behind The Spanish Blackout
-
 Alberta10 hours ago
Canadian Oil Sands Production Expected to Reach All-time Highs this Year Despite Lower Oil Prices
-
 Business12 hours ago
Potential For Abuse Embedded In Bill C-5