Canadian Energy Centre
North America LNG project cost competitiveness
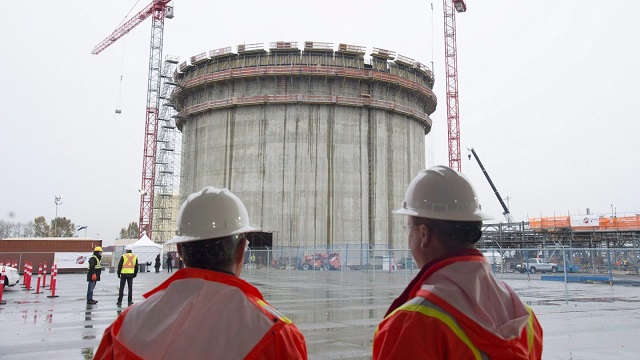


Construction workers look on at the FortisBC Tilbury LNG expansion project in Delta, B.C., Monday, Nov. 16, 2015. CP Images photo
From the Canadian Energy Centre
Lower costs for natural gas, shipping and liquefaction give Canada an edge in the emerging global LNG market
Worldwide concerns about energy security have put a renewed focus on the international liquefied natural gas (LNG) industry. The global demand for LNG is expected to increase over the next few decades.
Global demand growth will be driven primarily by Asian markets where the need for LNG is expected to increase from 277 million tonnes (MT) in 2025 to 509 MT by 2050 (see Figure 1). By 2050 the demand for LNG in Europe will be 83 MT and in Africa 20 MT. In South America too, demand will increase – from 13 MT in 2025 to 31 MT in 2050.

Source: Derived from Rystad Energy, Gas and LNG Markets Solution.
In North America (Canada, Mexico, and United States) a number of LNG projects that are either under construction or in the planning stages will benefit from the rise in global LNG demand.
North American LNG production is expected to grow from 112 MT in 2025 to over 255 MT by 2050 (see Figure 2). In Canada, the LNG projects under construction or in the planning stages include LNG Canada Phases 1 & 2, Woodfibre LNG, Cedar LNG, the Tilbury LNG expansion, and Ksi Lisims LNG. Canada’s LNG production is expected to grow from just 2 MT in 2025 to over 43 MT by 2050. In the United States production is projected to increase from 108 MT in 2025 to 210 MT in 2050.

Source: Derived from Rystad Energy, Gas and LNG Markets Solution.
This CEC Fact Sheet uses Rystad Energy’s Gas and LNG Markets Solution¹ to benchmark the cost competitiveness of LNG projects that are under construction and proposed in Canada compared to other LNG projects under construction and planned elsewhere in North America. (Note that the content of this report does not represent the views of Rystad Energy.)
The LNG cost competitiveness benchmarking analysis used the following performance metrics:
- LNG plant free-on-board (FOB) cost break-even;
- Total LNG plant cost (for delivery into Asia and Europe).
The objective of this LNG cost competitiveness benchmarking is to compare the competitiveness of Canadian LNG projects against those of major competitors in the United States and Mexico. The selection of other North American LNG facilities for the benchmark comparison with Canadian LNG projects (LNG Canada, the Tilbury LNG Expansion, Woodfibre LNG, Cedar LNG, and Ksi Lisims LNG) is based on the rationale that virtually all Canadian LNG plants are under construction or in the planning stage and that they compare well with other North American LNG plants that are also under construction or are being planned between 2023 and 2050. Further, to assess the cost competitiveness of the various LNG projects more accurately, we chose only North American LNG facilities with sufficient economic data to enable such a comparison. We compared the cost competitiveness of LNG coming from these other North American projects with LNG coming from Canada that is intended to be delivered to markets in Asia and Europe.
1. Rystad Energy is an independent energy research company providing data, analytics, and consultancy services to clients around the globe. Its Gas and LNG Markets Solution provides an overview of LNG markets worldwide. The Solution covers the entire value chain associated with gas and LNG production, country and sector-level demand, and LNG trade flows, infrastructure, economics, costs, and contracts through 2050. It allows for the evaluation of the entire LNG market infrastructure, including future planned projects, as well as the benchmarking of costs for LNG projects (Rystad Energy, 2024).
Comparison of LNG project FOB cost break-even (full cycle)
Figure 3 provides a comparison of the free-on-board (FOB) cost break-even for LNG facilities under construction or being planned in North America. FOB break-even costs include upstream and midstream costs for LNG excluding transportation costs (shipping) as seen from the current year. Break-even prices assume a discount rate of 10 percent and represent the point at which the net present value for an LNG project over a 20- to 30-year period becomes positive, including the payment of capital and operating costs, inclusive of taxes.
Among the selected group of North American LNG projects are Canadian LNG projects with an FOB break-even at the lower end of the range (US$7.18 per thousand cubic feet (kcf)) to those at the higher end (US$8.64 per thousand cubic feet (kcf)).
LNG projects in the United States tend to settle in the middle of the pack, with FOB break-even between US$6.44 per kcf and US$8.37 per kcf.
Mexico LNG projects have the widest variation in costs among the selected group of projects, ranging from US$6.94 per kcf to US$9.44 per kcf (see Figure 3).

Source: Derived from Rystad Energy, Gas and LNG Markets Solution.
Total costs by project for LNG delivery to Asia and Europe
The total cost by LNG plant includes FOB cost break-even, transportation costs, and the regasification tariff. Figure 4 compares total project costs for LNG destined for Asia from selected North American LNG facilities.
Canadian LNG projects are very cost competitive, and those with Asia as their intended market tend to cluster at the lower end of the scale. The costs vary by project, but range between US$8.10 per kcf and US$9.56 per kcf, making Canadian LNG projects among the lowest cost projects in North America.
The costs for Mexico’s LNG projects with Asia as the intended destination for their product tend to cluster in the middle of the pack. Costs among U.S. LNG facilities that plan to send their product to Asia tend to sit at the higher end of the scale, at between US$8.90 and US$10.80 per kcf.

Source: Derived from Rystad Energy, Gas and LNG Markets Solution.
Figure 5 compares total project costs for LNG to be delivered to Europe from select North American LNG facilities.
Costs from U.S. LNG facilities show the widest variation for this market at between US$7.48 per kcf and US$9.42 per kcf, but the majority of U.S. LNG facilities tend to cluster at the lower end of the cost scale, between US$7.48 per kcf and US$8.61 per kcf (see Figure 5).
Canadian projects that intend to deliver LNG to Europe show a variety of costs that tend to cluster at the middle to higher end of the spectrum, ranging from US$9.60 per kcf to and US$11.06 per kcf.
The costs of Mexico’s projects that are aimed at delivering LNG to Europe tend to cluster in the middle of the spectrum (US$9.11 per kcf to US$10.61 per kcf).

Source: Derived from Rystad Energy, Gas and LNG Markets Solution.
Conclusion
LNG markets are complex. Each project is unique and presents its own challenges. The future of Canadian LNG projects depends upon the overall demand and supply in the global LNG market. As the demand for LNG increases in the next decades, the world will be searching for energy security.
The lower liquefaction and shipping costs coupled with the lower cost of the natural gas itself in Western Canada translate into lower prices for Canadian LNG, particularly that destined for Asian markets. Those advantages will help make Canadian LNG very competitive and attractive to markets worldwide.
Canadian Energy Centre
Cross-Canada economic benefits of the proposed Northern Gateway Pipeline project
From the Canadian Energy Centre
Billions in government revenue and thousands of jobs across provinces
Announced in 2006, the Northern Gateway project would have built twin pipelines between Bruderheim, Alta. and a marine terminal at Kitimat, B.C.
One pipeline would export 525,000 barrels per day of heavy oil from Alberta to tidewater markets. The other would import 193,000 barrels per day of condensate to Alberta to dilute heavy oil for pipeline transportation.
The project would have generated significant economic benefits across Canada.

The following projections are drawn from the report Public Interest Benefits of the Northern Gateway Project (Wright Mansell Research Ltd., July 2012), which was submitted as reply evidence during the regulatory process.
Financial figures have been adjusted to 2025 dollars using the Bank of Canada’s Inflation Calculator, with $1.00 in 2012 equivalent to $1.34 in 2025.
Total Government Revenue by Region
Between 2019 and 2048, a period encompassing both construction and operations, the Northern Gateway project was projected to generate the following total government revenues by region (direct, indirect and induced):

British Columbia
- Provincial government revenue: $11.5 billion
- Federal government revenue: $8.9 billion
- Total: $20.4 billion
Alberta
- Provincial government revenue: $49.4 billion
- Federal government revenue: $41.5 billion
- Total: $90.9 billion
Ontario
- Provincial government revenue: $1.7 billion
- Federal government revenue: $2.7 billion
- Total: $4.4 billion
Quebec
- Provincial government revenue: $746 million
- Federal government revenue: $541 million
- Total: $1.29 billion
Saskatchewan
- Provincial government revenue: $6.9 billion
- Federal government revenue: $4.4 billion
- Total: $11.3 billion
Other
- Provincial government revenue: $1.9 billion
- Federal government revenue: $1.4 billion
- Total: $3.3 billion
Canada
- Provincial government revenue: $72.1 billion
- Federal government revenue: $59.4 billion
- Total: $131.7 billion
Annual Government Revenue by Region
Over the period 2019 and 2048, the Northern Gateway project was projected to generate the following annual government revenues by region (direct, indirect and induced):

British Columbia
- Provincial government revenue: $340 million
- Federal government revenue: $261 million
- Total: $601 million per year
Alberta
- Provincial government revenue: $1.5 billion
- Federal government revenue: $1.2 billion
- Total: $2.7 billion per year
Ontario
- Provincial government revenue: $51 million
- Federal government revenue: $79 million
- Total: $130 million per year
Quebec
- Provincial government revenue: $21 million
- Federal government revenue: $16 million
- Total: $37 million per year
Saskatchewan
- Provincial government revenue: $204 million
- Federal government revenue: $129 million
- Total: $333 million per year
Other
- Provincial government revenue: $58 million
- Federal government revenue: $40 million
- Total: $98 million per year
Canada
- Provincial government revenue: $2.1 billion
- Federal government revenue: $1.7 billion
- Total: $3.8 billion per year
Employment by Region
Over the period 2019 to 2048, the Northern Gateway Pipeline was projected to generate the following direct, indirect and induced full-time equivalent (FTE) jobs by region:

British Columbia
- Annual average: 7,736
- Total over the period: 224,344
Alberta
- Annual average: 11,798
- Total over the period: 342,142
Ontario
- Annual average: 3,061
- Total over the period: 88,769
Quebec
- Annual average: 1,003
- Total over the period: 29,087
Saskatchewan
- Annual average: 2,127
- Total over the period: 61,683
Other
- Annual average: 953
- Total over the period: 27,637
Canada
- Annual average: 26,678
- Total over the period: 773,662

Chief David Jimmie is president of Stonlasec8 and Chief of Squiala First Nation in B.C. He also chairs the Western Indigenous Pipeline Group. Photo courtesy Western Indigenous Pipeline Group
From the Canadian Energy Centre
Stonlasec8 agreement is Canada’s first federal Indigenous loan guarantee
The first federally backed Indigenous loan guarantee paves the way for increased prosperity for 36 First Nations communities in British Columbia.
In May, Canada Development Investment Corporation (CDEV) announced a $400 million backstop for the consortium to jointly purchase 12.5 per cent ownership of Enbridge’s Westcoast natural gas pipeline system for $712 million.
In the works for two years, the deal redefines long-standing relationships around a pipeline that has been in operation for generations.
“For 65 years, there’s never been an opportunity or a conversation about participating in an asset that’s come through the territory,” said Chief David Jimmie of the Squiala First Nation near Vancouver, B.C.
“We now have an opportunity to have our Nation’s voices heard directly when we have concerns and our partners are willing to listen.”
Jimmie chairs the Stonlasec8 Indigenous Alliance, which represents the communities buying into the Enbridge system.
The name Stonlasec8 reflects the different regions represented in the agreement, he said.
The Westcoast pipeline stretches more than 2,900 kilometres from northeast B.C. near the Alberta border to the Canada-U.S. border near Bellingham, Wash., running through the middle of the province.

It delivers up to 3.6 billion cubic feet per day of natural gas throughout B.C. and the Lower Mainland, Alberta and the U.S. Pacific Northwest.
“While we see the benefits back to communities, we are still reminded of our responsibility to the land, air and water so it is important to think of reinvestment opportunities in alternative energy sources and how we can offset the carbon footprint,” Jimmie said.
He also chairs the Western Indigenous Pipeline Group (WIPG), a coalition of First Nations communities working in partnership with Pembina Pipeline to secure an ownership stake in the newly expanded Trans Mountain pipeline system.
There is overlap between the communities in the two groups, he said.
CDEV vice-president Sébastien Labelle said provincial models such as the Alberta Indigenous Opportunities Corporation (AIOC) and Ontario’s Indigenous Opportunities Financing Program helped bring the federal government’s version of the loan guarantee to life.
“It’s not a new idea. Alberta started it before us, and Ontario,” Labelle said.
“We hired some of the same advisors AIOC hired because we want to make sure we are aligned with the market. We didn’t want to start something completely new.”
Broadly, Jimmie said the Stonlasec8 agreement will provide sustained funding for investments like housing, infrastructure, environmental stewardship and cultural preservation. But it’s up to the individual communities how to spend the ongoing proceeds.
The long-term cash injections from owning equity stakes of major projects can provide benefits that traditional funding agreements with the federal government do not, he said.
Labelle said the goal is to ensure Indigenous communities benefit from projects on their traditional territories.
“There’s a lot of intangible, indirect things that I think are hugely important from an economic perspective,” he said.
“You are improving the relationship with pipeline companies, you are improving social license to do projects like this.”
Jimmie stressed the impact the collaborative atmosphere of the negotiations had on the success of the Stonlasec8 agreement.
“It takes true collaboration to reach a successful partnership, which doesn’t always happen. And from the Nation representation, the sophistication of the group was one of the best I’ve ever worked with.”

How Chinese State-Linked Networks Replaced the Medellín Model with Global Logistics and Political Protection
New RCMP program steering opioid addicted towards treatment and recovery

We need an immigration policy that will serve all Canadians

EU investigates major pornographic site over failure to protect children
-
 conflict1 day ago
“Evacuate”: Netanyahu Warns Tehran as Israel Expands Strikes on Iran’s Military Command
-
 Health1 day ago
Last day and last chance to win this dream home! Support the 2025 Red Deer Hospital Lottery before midnight!
-
 Alberta2 days ago
Alberta’s grand bargain with Canada includes a new pipeline to Prince Rupert
-
 Energy1 day ago
Could the G7 Summit in Alberta be a historic moment for Canadian energy?
-
 Aristotle Foundation1 day ago
The Canadian Medical Association’s inexplicable stance on pediatric gender medicine
-
 Energy21 hours ago
Kananaskis G7 meeting the right setting for U.S. and Canada to reassert energy ties
-
 Business2 days ago
Carney’s European pivot could quietly reshape Canada’s sovereignty
-
 Business21 hours ago
Carney’s Honeymoon Phase Enters a ‘Make-or-Break’ Week