Brownstone Institute
Modeling Gone Bad

From the Brownstone Institute
A new paper documents that the pre-vaccination case fatality rate was extremely low in the non-elderly population.
Age-stratified infection fatality rate of COVID-19 in the non-elderly population
Environmental Research, Volume 216, Part 3, 1 January 2023, 114655
Abstract
The largest burden of COVID-19 is carried by the elderly, and persons living in nursing homes are particularly vulnerable. However, 94% of the global population is younger than 70 years and 86% is younger than 60 years. The objective of this study was to accurately estimate the infection fatality rate (IFR) of COVID-19 among non-elderly people in the absence of vaccination or prior infection. In systematic searches in SeroTracker and PubMed (protocol: https://osf.io/xvupr), we identified 40 eligible national seroprevalence studies covering 38 countries with pre-vaccination seroprevalence data. For 29 countries (24 high-income, 5 others), publicly available age-stratified COVID-19 death data and age-stratified seroprevalence information were available and were included in the primary analysis. The IFRs had a median of 0.034% (interquartile range (IQR) 0.013–0.056%) for the 0–59 years old population, and 0.095% (IQR 0.036–0.119%) for the 0–69 years old. The median IFR was 0.0003% at 0–19 years, 0.002% at 20–29 years, 0.011% at 30–39 years, 0.035% at 40–49 years, 0.123% at 50–59 years, and 0.506% at 60–69 years. IFR increases approximately 4 times every 10 years. Including data from another 9 countries with imputed age distribution of COVID-19 deaths yielded median IFR of 0.025–0.032% for 0–59 years and 0.063–0.082% for 0–69 years. Meta-regression analyses also suggested global IFR of 0.03% and 0.07%, respectively in these age groups.
The current analysis suggests a much lower pre-vaccination IFR in non-elderly populations than previously suggested.
Large differences did exist between countries and may reflect differences in comorbidities and other factors. These estimates provide a baseline from which to fathom further IFR declines with the widespread use of vaccination, prior infections, and evolution of new variants.

From the data above, Median infection fatality rate (IFR) during the PRE-VACCINATION ERA was:
- 0.0003% at 0–19 years
- 0.002% at 20–29 years
- 0.011% at 30–39 years
- 0.035% at 40–49 years
- 0.123% at 50–59 years
- 0.506% at 60–69 years
- 0.034% for people aged 0–59 years people
- .095% for those aged 0–69 years.
These IFR estimates in the non-elderly population are much lower than previous calculations and models had suggested.
Does anyone remember back to early 2020? The dire predictions of a global disaster – of a case fatality rate and of an infectivity rate (R0) that were unheard of in modern times for a respiratory disease? The predictions were that the “novel coronavirus,” as it was called then, was going to be the next Spanish flu. That the only solution was for entire nations to lockdown. This was the modeling that caused governments worldwide to panic. This was the modeling that caused the legacy media to melt down.
One scientist who clearly led this effort and led the world astray with his dire forecasting, was Neil Ferguson, PhD of Imperial College.
Ferguson’s team at Imperial College London has claimed credit for saving millions of lives through the lockdown policies that implemented his models. It is the Imperial College models that projected millions of deaths in the first year in the UK, if stringent lockdowns were not implemented. Once implemented, Ferguson and Imperial college quickly took credit for the “success” of lockdowns.
The estimate of 3.1 million lives saved by Dr. Ferguson was derived from a thoroughly “ludicrous unscientific exercise, whereby they purported to validate their model by using their own hypothetical projections as a counterfactual of what would happen without lockdowns.” Other models and real-world data have discredited Ferguson’s models, but the damage was done. Lockdowns, quarantines, masking, poorly-tested EUA products – such as experimental vaccines have taken their toll on all of us. In the end, what, if any of them were necessary?
Elon Musk calls Ferguson an “utter tool” who does “absurdly fake science.” Jay Schnitzer, an expert in vascular biology and a former scientific direct of the Sidney Kimmel Cancer Center in San Diego, tells me: “I’m normally reluctant to say this about a scientist, but he dances on the edge of being a publicity-seeking charlatan” (National Review).
Again and again, year and year, decade after decade, the NHS and world governments, including our own, have turned to Dr. Ferguson for infectious disease modeling. Ferguson gives them what they want. A reason for the bureaucrats, the administrative state to once more step up and be important. One of his doom-and-gloom models can increase federal disaster preparedness budgets to astronomical proportions. That is raw power for the lowly public health official. What is not to like?
Except for a singular factoid:
Ferguson’s predictions of sky-high high case fatality rates were grossly exaggerated.
The lockdowns were a complete and utter failure.
But this is not Ferguson’s first failed infectious disease modeling stumble upon the world stage. These are two examples of his earlier predictions:
- Ferguson predicted that up to 150 million people could be killed from bird flu during the 2005 outbreak. This prediction was off by an astounding amount, with a grand total of 282 people dying worldwide from the disease between 2003 and 2009.
- In 2009, one of Ferguson’s models predicted 65,000 people could die from the Swine Flu outbreak in the UK — the final figure was below 500. This modeling was what caused so many public health officials to panic, and create a worldwide panic of officials and the populace.
So, why did Boris Johnson and our government turn to his models for guidance early on in the COVID crisis? Why did they accept Ferguson’s assertions that lockdowns would work, without any evidence or public policy guidance indicating that such draconian measures would have any impact whatsoever?
Were they just that naive?
Here is where it gets even crazier. There are those who passionately argue that the modeling that Ferguson did back in early 2020 is proof that 1) the “non-pharmaceutical interventions (lockdowns and masks) worked because (circular logic here) his modeling predictions didn’t come true and 2) that the vaccines worked beyond all measure because again, his modeling predictions didn’t come true.
Yet, here we are. An important new paper (discussed above) documenting that the pre-vaccination case fatality rate was extremely low in the non-elderly population. That means more evidence the Ferguson’s models were wrong (again) and what do we hear from the state-sponsored media?
Crickets.
A colleague of mine who is in the US Senate reported back to me recently that Republican senators were high-fiving each other about the success of Warp-speed based on Ferguson’s modeling data in a recently paper.
You can’t make this stuff up.
Republished from the author’s Substack.
Author


From the Brownstone Institute
The US Food and Drug Administration (FDA) has approved hundreds of drugs without proof that they work—and in some cases, despite evidence that they cause harm.
That’s the finding of a blistering two-year investigation by medical journalists Jeanne Lenzer and Shannon Brownlee, published by The Lever.
Reviewing more than 400 drug approvals between 2013 and 2022, the authors found the agency repeatedly ignored its own scientific standards.
One expert put it bluntly—the FDA’s threshold for evidence “can’t go any lower because it’s already in the dirt.”
A System Built on Weak Evidence
The findings were damning—73% of drugs approved by the FDA during the study period failed to meet all four basic criteria for demonstrating “substantial evidence” of effectiveness.
Those four criteria—presence of a control group, replication in two well-conducted trials, blinding of participants and investigators, and the use of clinical endpoints like symptom relief or extended survival—are supposed to be the bedrock of drug evaluation.
Yet only 28% of drugs met all four criteria—40 drugs met none.
These aren’t obscure technicalities—they are the most basic safeguards to protect patients from ineffective or dangerous treatments.
But under political and industry pressure, the FDA has increasingly abandoned them in favour of speed and so-called “regulatory flexibility.”
Since the early 1990s, the agency has relied heavily on expedited pathways that fast-track drugs to market.
In theory, this balances urgency with scientific rigour. In practice, it has flipped the process. Companies can now get drugs approved before proving that they work, with the promise of follow-up trials later.
But, as Lenzer and Brownlee revealed, “Nearly half of the required follow-up studies are never completed—and those that are often fail to show the drugs work, even while they remain on the market.”
“This represents a seismic shift in FDA regulation that has been quietly accomplished with virtually no awareness by doctors or the public,” they added.
More than half the approvals examined relied on preliminary data—not solid evidence that patients lived longer, felt better, or functioned more effectively.
And even when follow-up studies are conducted, many rely on the same flawed surrogate measures rather than hard clinical outcomes.
The result: a regulatory system where the FDA no longer acts as a gatekeeper—but as a passive observer.
Cancer Drugs: High Stakes, Low Standards
Nowhere is this failure more visible than in oncology.
Only 3 out of 123 cancer drugs approved between 2013 and 2022 met all four of the FDA’s basic scientific standards.
Most—81%—were approved based on surrogate endpoints like tumour shrinkage, without any evidence that they improved survival or quality of life.
Take Copiktra, for example—a drug approved in 2018 for blood cancers. The FDA gave it the green light based on improved “progression-free survival,” a measure of how long a tumour stays stable.
But a review of post-marketing data showed that patients taking Copiktra died 11 months earlier than those on a comparator drug.
It took six years after those studies showed the drug reduced patients’ survival for the FDA to warn the public that Copiktra should not be used as a first- or second-line treatment for certain types of leukaemia and lymphoma, citing “an increased risk of treatment-related mortality.”
Elmiron: Ineffective, Dangerous—And Still on the Market
Another striking case is Elmiron, approved in 1996 for interstitial cystitis—a painful bladder condition.
The FDA authorized it based on “close to zero data,” on the condition that the company conduct a follow-up study to determine whether it actually worked.
That study wasn’t completed for 18 years—and when it was, it showed Elmiron was no better than placebo.
In the meantime, hundreds of patients suffered vision loss or blindness. Others were hospitalized with colitis. Some died.
Yet Elmiron is still on the market today. Doctors continue to prescribe it.
“Hundreds of thousands of patients have been exposed to the drug, and the American Urological Association lists it as the only FDA-approved medication for interstitial cystitis,” Lenzer and Brownlee reported.
“Dangling Approvals” and Regulatory Paralysis
The FDA even has a term—”dangling approvals”—for drugs that remain on the market despite failed or missing follow-up trials.
One notorious case is Avastin, approved in 2008 for metastatic breast cancer.
It was fast-tracked, again, based on ‘progression-free survival.’ But after five clinical trials showed no improvement in overall survival—and raised serious safety concerns—the FDA moved to revoke its approval for metastatic breast cancer.
The backlash was intense.
Drug companies and patient advocacy groups launched a campaign to keep Avastin on the market. FDA staff received violent threats. Police were posted outside the agency’s building.
The fallout was so severe that for more than two decades afterwards, the FDA did not initiate another involuntary drug withdrawal in the face of industry opposition.
Billions Wasted, Thousands Harmed
Between 2018 and 2021, US taxpayers—through Medicare and Medicaid—paid $18 billion for drugs approved under the condition that follow-up studies would be conducted. Many never were.
The cost in lives is even higher.
A 2015 study found that 86% of cancer drugs approved between 2008 and 2012 based on surrogate outcomes showed no evidence that they helped patients live longer.
An estimated 128,000 Americans die each year from the effects of properly prescribed medications—excluding opioid overdoses. That’s more than all deaths from illegal drugs combined.
A 2024 analysis by Danish physician Peter Gøtzsche found that adverse effects from prescription medicines now rank among the top three causes of death globally.
Doctors Misled by the Drug Labels
Despite the scale of the problem, most patients—and most doctors—have no idea.
A 2016 survey published in JAMA asked practising physicians a simple question—what does FDA approval actually mean?
Only 6% got it right.
The rest assumed that it meant the drug had shown clear, clinically meaningful benefits—such as helping patients live longer or feel better—and that the data was statistically sound.
But the FDA requires none of that.
Drugs can be approved based on a single small study, a surrogate endpoint, or marginal statistical findings. Labels are often based on limited data, yet many doctors take them at face value.
Harvard researcher Aaron Kesselheim, who led the survey, said the results were “disappointing, but not entirely surprising,” noting that few doctors are taught about how the FDA’s regulatory process actually works.
Instead, physicians often rely on labels, marketing, or assumptions—believing that if the FDA has authorized a drug, it must be both safe and effective.
But as The Lever investigation shows, that is not a safe assumption.
And without that knowledge, even well-meaning physicians may prescribe drugs that do little good—and cause real harm.
Who Is the FDA Working for?
In interviews with more than 100 experts, patients, and former regulators, Lenzer and Brownlee found widespread concern that the FDA has lost its way.
Many pointed to the agency’s dependence on industry money. A BMJ investigation in 2022 found that user fees now fund two-thirds of the FDA’s drug review budget—raising serious questions about independence.

Yale physician and regulatory expert Reshma Ramachandran said the system is in urgent need of reform.
“We need an agency that’s independent from the industry it regulates and that uses high-quality science to assess the safety and efficacy of new drugs,” she told The Lever. “Without that, we might as well go back to the days of snake oil and patent medicines.”
For now, patients remain unwitting participants in a vast, unspoken experiment—taking drugs that may never have been properly tested, trusting a regulator that too often fails to protect them.
And as Lenzer and Brownlee conclude, that trust is increasingly misplaced.
- Investigative report by Jeanne Lenzer and Shannon Brownlee at The Lever [link]
- Searchable public drug approval database [link]
- See my talk: Failure of Drug Regulation: Declining standards and institutional corruption
Republished from the author’s Substack
Author

From the Brownstone Institute
By 
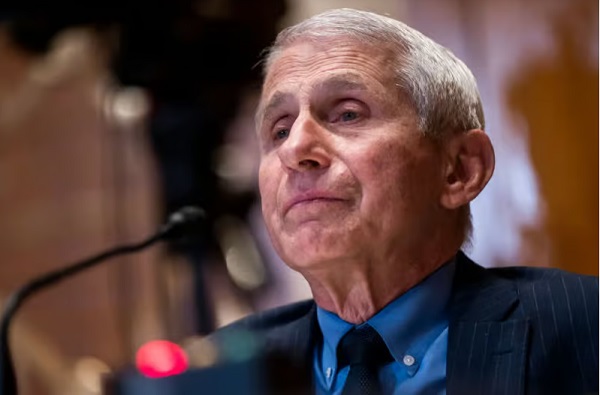
Anthony Fauci must be furious.
He spent years proudly being the public face of the country’s response to the Covid-19 pandemic. He did, however, flip-flop on almost every major issue, seamlessly managing to shift his guidance based on current political whims and an enormous desire to coerce behavior.
Nowhere was this more obvious than his dictates on masks. If you recall, in February 2020, Fauci infamously stated on 60 Minutes that masks didn’t work. That they didn’t provide the protection people thought they did, there were gaps in the fit, and wearing masks could actually make things worse by encouraging wearers to touch their face.
Just a few months later, he did a 180, then backtracked by making up a post-hoc justification for his initial remarks. Laughably, Fauci said that he recommended against masks to protect supply for healthcare workers, as if hospitals would ever buy cloth masks on Amazon like the general public.
Later in interviews, he guaranteed that cities or states that listened to his advice would fare better than those that didn’t. Masks would limit Covid transmission so effectively, he believed, that it would be immediately obvious which states had mandates and which didn’t. It was obvious, but not in the way he expected.

And now, finally, after years of being proven wrong, the White House has officially and thoroughly rebuked Fauci in every conceivable way.
White House Covid Page Points Out Fauci’s Duplicitous Guidance
A new White House official page points out, in detail, exactly where Fauci and the public health expert class went wrong on Covid.
It starts by laying out the case for the lab-leak origin of the coronavirus, with explanations of how Fauci and his partners misled the public by obscuring information and evidence. How they used the “FOIA lady” to hide emails, used private communications to avoid scrutiny, and downplayed the conduct of EcoHealth Alliance because they helped fund it.
They roast the World Health Organization for caving to China and attempting to broaden its powers in the aftermath of “abject failure.”
“The WHO’s response to the COVID-19 pandemic was an abject failure because it caved to pressure from the Chinese Communist Party and placed China’s political interests ahead of its international duties. Further, the WHO’s newest effort to solve the problems exacerbated by the COVID-19 pandemic — via a “Pandemic Treaty” — may harm the United States,” the site reads.
Social distancing is criticized, correctly pointing out that Fauci testified that there was no scientific data or evidence to support their specific recommendations.
“The ‘6 feet apart’ social distancing recommendation — which shut down schools and small business across the country — was arbitrary and not based on science. During closed door testimony, Dr. Fauci testified that the guidance ‘sort of just appeared.’”
There’s another section demolishing the extended lockdowns that came into effect in blue states like California, Illinois, and New York. Even the initial lockdown, the “15 Days to Slow the Spread,” was a poorly reasoned policy that had no chance of working; extended closures were immensely harmful with no demonstrable benefit.
“Prolonged lockdowns caused immeasurable harm to not only the American economy, but also to the mental and physical health of Americans, with a particularly negative effect on younger citizens. Rather than prioritizing the protection of the most vulnerable populations, federal and state government policies forced millions of Americans to forgo crucial elements of a healthy and financially sound life,” it says.
Then there’s the good stuff: mask mandates. While there’s plenty more detail that could be added, it’s immensely rewarding to see, finally, the truth on an official White House website. Masks don’t work. There’s no evidence supporting mandates, and public health, especially Fauci, flip-flopped without supporting data.
“There was no conclusive evidence that masks effectively protected Americans from COVID-19. Public health officials flipped-flopped on the efficacy of masks without providing Americans scientific data — causing a massive uptick in public distrust.”
This is inarguably true. There were no new studies or data justifying the flip-flop, just wishful thinking and guessing based on results in Asia. It was an inexcusable, world-changing policy that had no basis in evidence, but was treated as equivalent to gospel truth by a willing media and left-wing politicians.
Over time, the CDC and Fauci relied on ridiculous “studies” that were quickly debunked, anecdotes, and ever-shifting goal posts. Wear one cloth mask turned to wear a surgical mask. That turned into “wear two masks,” then wear an N95, then wear two N95s.
All the while ignoring that jurisdictions that tried “high-quality” mask mandates also failed in spectacular fashion.

And that the only high-quality evidence review on masking confirmed no masks worked, even N95s, to prevent Covid transmission, as well as hearing that the CDC knew masks didn’t work anyway.
The website ends with a complete and thorough rebuke of the public health establishment and the Biden administration’s disastrous efforts to censor those who disagreed.
“Public health officials often mislead the American people through conflicting messaging, knee-jerk reactions, and a lack of transparency. Most egregiously, the federal government demonized alternative treatments and disfavored narratives, such as the lab-leak theory, in a shameful effort to coerce and control the American people’s health decisions.
When those efforts failed, the Biden Administration resorted to ‘outright censorship—coercing and colluding with the world’s largest social media companies to censor all COVID-19-related dissent.’”
About time these truths are acknowledged in a public, authoritative manner. Masks don’t work. Lockdowns don’t work. Fauci lied and helped cover up damning evidence.
If only this website had been available years ago.
Though, of course, knowing the media’s political beliefs, they’d have ignored it then, too.
Republished from the author’s Substack
Author

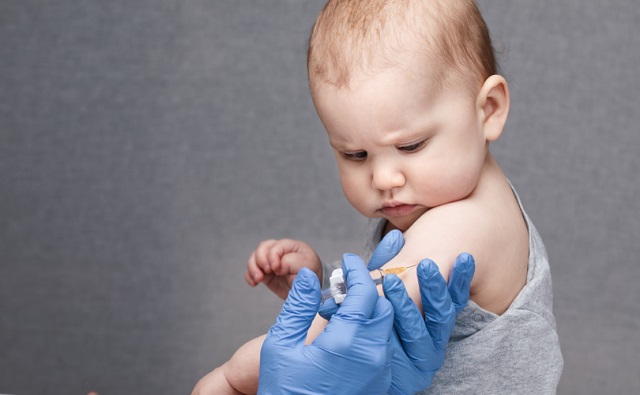
RFK Jr. says Hep B vaccine is linked to 1,135% higher autism rate
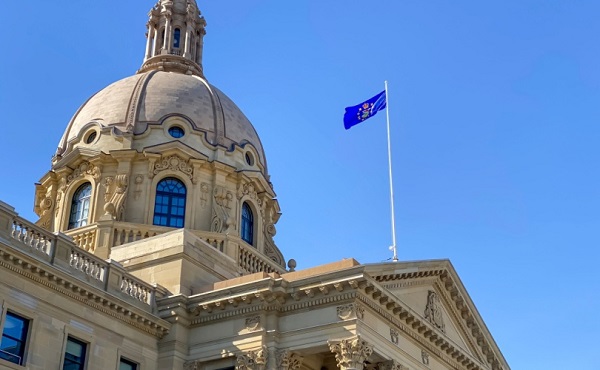
Alberta Independence Seekers Take First Step: Citizen Initiative Application Approved, Notice of Initiative Petition Issued

RFK Jr. Unloads Disturbing Vaccine Secrets on Tucker—And Surprises Everyone on Trump

National Health Care Fraud Takedown Results in 324 Defendants Charged in Connection with Over $14.6 Billion in Alleged Fraud
-
 Indigenous2 days ago
Internal emails show Canadian gov’t doubted ‘mass graves’ narrative but went along with it
-
 Bruce Dowbiggin2 days ago
Eau Canada! Join Us In An Inclusive New National Anthem
-
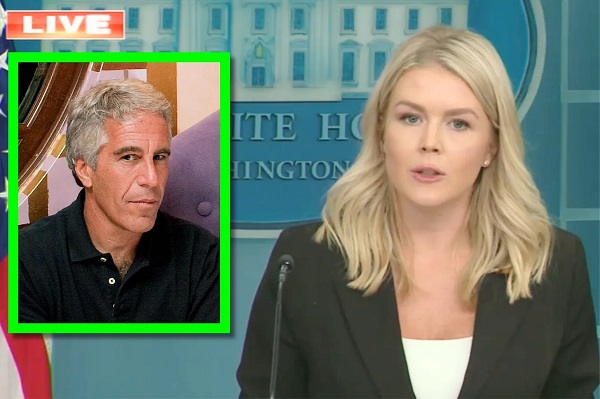 Crime2 days ago
Eyebrows Raise as Karoline Leavitt Answers Tough Questions About Epstein
-
 Business2 days ago
Carney’s new agenda faces old Canadian problems
-
 Alberta2 days ago
COWBOY UP! Pierre Poilievre Promises to Fight for Oil and Gas, a Stronger Military and the Interests of Western Canada
-
 Alberta2 days ago
Alberta and Ontario sign agreements to drive oil and gas pipelines, energy corridors, and repeal investment blocking federal policies
-
 Crime1 day ago
“This is a total fucking disaster”
-
 International2 days ago
Chicago suburb purchases childhood home of Pope Leo XIV