Connect with us

Economy

Federal government’s recent fiscal record includes unprecedented levels of spending and debt

Published

4 minute read

From the Fraser Institute

By Jake Fuss and Grady Munro

As of 2024, Ottawa’s debt equals $51,467 per Canadian—12.3 per cent more than in 1995 when Canada reached a near-debt crisis.

According to an Angus Reid poll from earlier this year, 59 per cent of Canadians believe the federal government is spending too much and 64 per cent said they’re concerned about the size of the budget deficit. Nanos Research had similar polling results, finding 63 per cent of Canadians want Ottawa to reduce spending. These polling results are not surprising given the alarming state of federal finances.

The Trudeau government has consistently spent at record-high levels before, during and after COVID. In fact, Prime Minister Trudeau is on track to record the seven-highest years of per-person spending in Canadian history between 2018 and 2024. Inflation-adjusted spending (excluding debt interest costs) is expected to reach $11,856 per person this year—10.2 per cent higher than during the 2008-09 financial crisis and 28.7 per cent higher than during the peak of the Second World War.

Consequently, the Trudeau government has posted 10 consecutive deficits since taking office. The projected deficit in 2024/25 is a whopping $39.8 billion. This string of deficits has spurred a dramatic increase in federal debt. From 2014/15 (Prime Minister Harper’s last full year) to 2024/25, total federal debt is expected to have nearly doubled to $2.1 trillion. To make matters worse, the government plans to run more deficits until at least 2028/29 and total debt could rise by an additional $400.1 billion by March 2029.

Indeed, due to reckless decisions, the Trudeau government is on track to record the five-highest years of per-person debt (inflation-adjusted) in Canadian history between 2020 and 2024. As of 2024, Ottawa’s debt equals $51,467 per Canadian—12.3 per cent more than in 1995 when Canada reached a near-debt crisis.

Worse still, that doesn’t include any provincial or municipal debt, so the total government debt burden per Canadian is considerably higher.

Of course, to pay for this sky-high spending, the Trudeau government has borrowed and raised taxes. In addition to recently raising taxes on capital gains—harming entrepreneurship, investment and growth—the government has raised personal income taxes on middle-income families. Today, 86 per cent of middle-income Canadian families pay more in taxes than they did in 2015.

And what has this combination of tax increases and record-high spending and debt delivered for Canadians?

Amid widespread concerns about the rising cost of living, the average Canadian family is spending more on taxes than on food, shelter and clothing combined. Despite a recent federal budget supposedly focused on “fairness for every generation,” younger generations face a disproportionately higher tax burden in the future due to debt accumulated today. Meanwhile, Canadian living standards (as measured by inflation-adjusted GDP per person) are in a historic decline and (as of June 2024) stood 3.2 per cent below 2019 levels.

The current state of federal finances is simply unacceptable. Ottawa can and must do better. Canadians are already feeling the consequences, and it will only continue to get worse for future generations if we don’t constrain spending and return to balanced budgets soon.

Todayville is a digital media and technology company. We profile unique stories and events in our community. Register and promote your community event for free.

Follow Author

Business

Canada Caves: Carney ditches digital services tax after criticism from Trump

Published on

From The Center Square

By

Canada caved to President Donald Trump demands by pulling its digital services tax hours before it was to go into effect on Monday.

Trump said Friday that he was ending all trade talks with Canada over the digital services tax, which he called a direct attack on the U.S. and American tech firms. The DST required foreign and domestic businesses to pay taxes on some revenue earned from engaging with online users in Canada.

“Based on this egregious Tax, we are hereby terminating ALL discussions on Trade with Canada, effective immediately,” the president said. “We will let Canada know the Tariff that they will be paying to do business with the United States of America within the next seven day period.”

By Sunday, Canada relented in an effort to resume trade talks with the U.S., it’s largest trading partner.

“To support those negotiations, the Minister of Finance and National Revenue, the Honourable François-Philippe Champagne, announced today that Canada would rescind the Digital Services Tax (DST) in anticipation of a mutually beneficial comprehensive trade arrangement with the United States,” according to a statement from Canada’s Department of Finance.

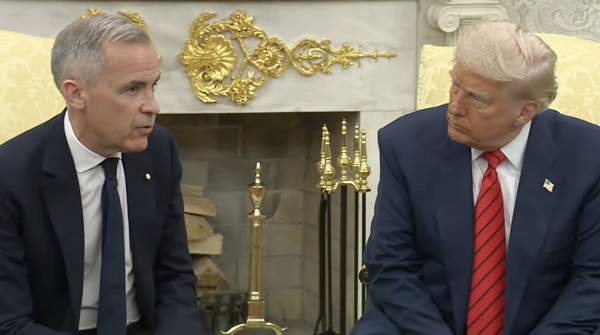
Canada’s Department of Finance said that Prime Minister Mark Carney and Trump agreed to resume negotiations, aiming to reach a deal by July 21.

U.S. Commerce Secretary Howard Lutnick said Monday that the digital services tax would hurt the U.S.

“Thank you Canada for removing your Digital Services Tax which was intended to stifle American innovation and would have been a deal breaker for any trade deal with America,” he wrote on X.

Earlier this month, the two nations seemed close to striking a deal.

Trump said he and Carney had different concepts for trade between the two neighboring countries during a meeting at the G7 Summit in Kananaskis, in the Canadian Rockies.

Asked what was holding up a trade deal between the two nations at that time, Trump said they had different concepts for what that would look like.

“It’s not so much holding up, I think we have different concepts, I have a tariff concept, Mark has a different concept, which is something that some people like, but we’re going to see if we can get to the bottom of it today.”

Shortly after taking office in January, Trump hit Canada and Mexico with 25% tariffs for allowing fentanyl and migrants to cross their borders into the U.S. Trump later applied those 25% tariffs only to goods that fall outside the free-trade agreement between the three nations, called the United States-Mexico-Canada Agreement.

Trump put a 10% tariff on non-USMCA compliant potash and energy products. A 50% tariff on aluminum and steel imports from all countries into the U.S. has been in effect since June 4. Trump also put a 25% tariff on all cars and trucks not built in the U.S.

Economists, businesses and some publicly traded companies have warned that tariffs could raise prices on a wide range of consumer products.

Trump has said he wants to use tariffs to restore manufacturing jobs lost to lower-wage countries in decades past, shift the tax burden away from U.S. families, and pay down the national debt.

A tariff is a tax on imported goods paid by the person or company that imports them. The importer can absorb the cost of the tariffs or try to pass the cost on to consumers through higher prices.

Trump’s tariffs give U.S.-produced goods a price advantage over imported goods, generating revenue for the federal government.

Continue Reading

Alberta

Canadian Oil Sands Production Expected to Reach All-time Highs this Year Despite Lower Oil Prices

Published on

From Energy Now

S&P Global Commodity Insights has raised its 10-year production outlook for the Canadian oil sands. The latest forecast expects oil sands production to reach a record annual average production of 3.5 million b/d in 2025 (5% higher than 2024) and exceed 3.9 million b/d by 2030—half a million barrels per day higher than 2024. The 2030 projection is 100,000 barrels per day (or nearly 3%) higher than the previous outlook.

The new forecast, produced by the S&P Global Commodity Insights Oil Sands Dialogue, is the fourth consecutive upward revision to the annual outlook. Despite a lower oil price environment, the analysis attributes the increased projection to favorable economics, as producers continue to focus on maximizing existing assets through investments in optimization and efficiency.


Get the Latest Canadian Focused Energy News Delivered to You! It’s FREE: Quick Sign-Up Here


While large up-front, out-of-pocket expenditures over multiple years are required to bring online new oil sands projects, once completed, projects enjoy relatively low breakeven prices.

S&P Global Commodity Insights estimates that the 2025 half-cycle break-even for oil sands production ranged from US$18/b to US$45/b, on a WTI basis, with the overall average break-even being approximately US$27/b.*

“The increased trajectory for Canadian oil sands production growth amidst a period of oil price volatility reflects producers’ continued emphasis on optimization—and the favorable economics that underpin such operations,” said Kevin Birn, Chief Canadian Oil Analyst, S&P Global Commodity Insights. “More than 3.8 million barrels per day of existing installed capacity was brought online from 2001 and 2017. This large resource base provides ample room for producers to find debottlenecking opportunities, decrease downtime and increase throughput.”

The potential for additional upside exists given the nature of optimization projects, which often result from learning by doing or emerge organically, the analysis says.

“Many companies are likely to proceed with optimizations even in more challenging price environments because they often contribute to efficiency gains,” said Celina Hwang, Director, Crude Oil Markets, S&P Global Commodity Insights. “This dynamic adds to the resiliency of oil sands production and its ability to grow through periods of price volatility.”

The outlook continues to expect oil sands production to enter a plateau later this decade. However, this is also expected to occur at a higher level of production than previously estimated. The new forecast expects oil sands production to be 3.7 million b/d in 2035—100,000 b/d higher than the previous outlook.

Export capacity—already a concern in recent years—is a source of downside risk now that even more production growth is expected. Without further incremental pipeline capacity, export constraints have the potential to re-emerge as early as next year, the analysis says.

“While a lower price path in 2025 and the potential for pipeline export constraints are downside risks to this outlook, the oil sands have proven able to withstand extreme price volatility in the past,” said Hwang. “The low break-even costs for existing projects and producers’ ability to manage challenging situations in the past support the resilience of this outlook.”

* Half-cycle breakeven cost includes operating cost, the cost to purchase diluent (if needed), as well as an adjustment to enable a comparison to WTI—specifically, the cost of transport to Cushing, OK and quality differential between heavy and light oil.

About S&P Global Commodity Insights

At S&P Global Commodity Insights, our complete view of global energy and commodity markets enables our customers to make decisions with conviction and create long-term, sustainable value.

We’re a trusted connector that brings together thought leaders, market participants, governments, and regulators and we create solutions that lead to progress. Vital to navigating commodity markets, our coverage includes oil and gas, power, chemicals, metals, agriculture, shipping and energy transition. Platts® products and services, including leading benchmark price assessments in the physical commodity markets, are offered through S&P Global Commodity Insights. S&P Global Commodity Insights maintains clear structural and operational separation between its price assessment activities and the other activities carried out by S&P Global Commodity Insights and the other business divisions of S&P Global.

S&P Global Commodity Insights is a division of S&P Global (NYSE: SPGI). S&P Global is the world’s foremost provider of credit ratings, benchmarks, analytics and workflow solutions in the global capital, commodity and automotive markets. With every one of our offerings, we help many of the world’s leading organizations navigate the economic landscape so they can plan for tomorrow, today. For more information visit https://www.spglobal.com/commodity-insights/en.

SOURCE S&P Global Commodity Insights

Continue Reading

Trending

X