Canadian Energy Centre
Canadian energy producers among worlds’ best at limiting gas flaring
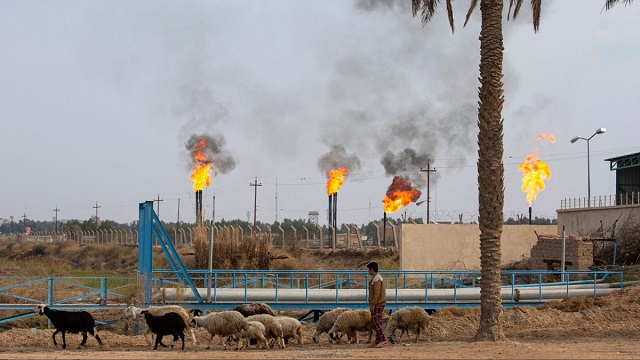
The Nahr Bin Omar oil field and facility near Iraq’s southern port city of Basra on February 11, 2022. In the oilfields of southern Iraq, billions of cubic feet of gas literally go up in smoke, burnt off on flare stacks for want of the infrastructure to capture and process it. (Photo by HUSSEIN FALEH/AFP via Getty Images)
From the Canadian Energy Centre
International comparisons of gas flaring among top oil producers
Canada contributed just 0.7% of the global amount of gas flaring despite being the world’s fourth-largest oil producer
By Ven Venkatachalam and Lennie Kaplan
This Fact Sheet analyzes the upstream oil industry’s record on flaring in Canada relative to other top oil-producing countries. Gas flaring is the burning off of the natural gas that is generated in the process of oil extraction and production. Flaring is relevant because it is a source of greenhouse gas emissions (GHGs) (see Appendix).
In 2022, 138,549 million cubic meters (m3) (or 139 billion cubic meters (bcm)) of flared gases were emitted worldwide, creating 350 million tonnes of CO2 emissions annually. Canada is a significant oil producer; it has the third-largest proven crude oil reserves and is the fourthlargest crude oil producer in the world (Natural Resources Canada, undated), and so contributes to flaring.
Flaring comparisons
This Fact Sheet uses World Bank data to provide international comparisons of flaring. It also draws on U.S. Energy Information Administration (EIA) crude oil production data to compare flaring among the top 10 crude oil producing countries.
Table 1 shows gas flaring volumes in 2012 and 2022. In absolute terms, Russia recorded more flaring than any other country at 25,495 million m3 (25.4 bcm) in 2022, which was 1,628 million m3 (7 per cent) higher than in 2012.
The four countries that are the top GHG emitters through flaring (Russia, Iraq, Iran, and Algeria) accounted for 50 per cent of global gas flaring in 2022.
At 945 million m3, Canada was the eighth lowest flarer in 2022 (23rd spot out of the top 30 countries). It decreased its flaring emissions by 320 million m3 from the 2012 level of 1,264 million m3, a 25 per cent drop.
In 2022, Canada contributed just 0.7 per cent of the global amount of gas flaring despite being the world’s fourth largest oil producer (see Table 1).

Sources: World Bank (undated)
Flaring declined worldwide between 2012 and 2022
Figure 1 shows the change in flaring volumes between 2012 and 2022. Nine countries flared more in 2022 than in 2012, while 21 countries flared less. In the last decade, the global flaring volume decreased by 3 per cent.
- The three countries that most significantly increased flaring between 2012 and 2022 were the Republic of the Congo (65 per cent), Iran (56 per cent), and Iraq (41 per cent).
- The three countries that most significantly decreased flaring between 2012 and 2022 were Uzbekistan (-76 per cent), Columbia (-75 per cent) and Kazakhstan (-74 per cent).
- As noted earlier, flaring fell by 25 per cent in Canada between 2012 and 2022.

Sources: World Bank (undated)
Comparing flaring to increased production
The decreases in flaring in Canada between 2012 and 2022 shown in Table 1 and Figure 1 understate the magnitude of the decline in flaring in the country. That is because Canada’s crude oil production increased by 45 per cent in that period, even as absolute flaring decreased by 25 per cent (see Table 2).
Canada compares very favourably with the United States, which increased crude oil production by 82 per cent and decreased flaring by 16 per cent.

Sources: World Bank (undated) and EIA (2023)
Largest oil producers and flaring intensity
To fully grasp how much more effective Canada has been than many other oil producers in reducing flaring, Table 3 compares both flaring intensity (gas flared per unit of oil production) and crude oil production among the top 10 oil producing countries (which account for 73 per cent of the world oil production).
Canada is the fourth-largest producer of crude oil, and its gas flaring intensity declined by 48 per cenft between 2012 and 2022. Four of the top 10 oil producers witnessed their flaring intensity increase between 2012 and 2022.

Sources: World Bank (undated) and EIA (2023)
Conclusion
Gas flaring contributes to greenhouse gas emissions. However, it is possible for countries to both increase their oil production and still reduce flaring. Canada is one noteworthy example of a country that has significantly reduced flaring not only compared to its increased production of crude oil, but also in absolute terms.
Appendix
Background
Flaring and venting are two ways in which an oil or natural gas producer can dispose of waste gases. Venting is the intentional controlled release of uncombusted gases directly to the atmosphere, and flaring is combusting natural gas or gas derived from petroleum in order to dispose of it.¹ As Matthew R. Johnson and Adam R. Coderre noted in their 2012 paper on the subject, flaring in the petroleum industry generally falls within three broad categories:
- Emergency flaring (large, unplanned, and very short-duration releases, typically at larger downstream facilities or off-shore platforms);
- Process flaring (intermittent large or small releases that may last for a few hours or a few days as occurs in the upstream industry during well-test flaring to assess the size of a reservoir or at a downstream plant during a planned process blowdown); and
- Production flaring (may occur continuously for years while oil is being produced).
To track GHGs from flaring and venting, Environment Canada (2016) defines such emissions as:
- Fugitive emissions: Unintentional releases from venting, flaring, or leakage of gases from fossil fuel production and processing, iron and steel coke oven batteries, or CO2 capture, transport, injection, and storage infrastructure.
- Flaring emissions: Controlled releases of gases from industrial activities from the combustion of a gas or liquid stream produced at a facility, the purpose of which is not to produce useful heat or work. This includes releases from waste petroleum incineration, hazardous emission prevention systems, well testing, natural gas gathering systems, natural gas processing plant operations, crude oil production, pipeline operations, petroleum refining, chemical fertilizer production, and steel production.
- Venting emissions: Controlled releases of a process or waste gas, including releases of CO2 associated with carbon capture, transport, injection, and storage; from hydrogen production associated with fossil fuel production and processing; of casing gas; of gases associated with a liquid or a solution gas; of treater, stabilizer, or dehydrator off-gas; of blanket gases; from pneumatic devices that use natural gas as a driver; from compressor start-ups, pipelines, and other blowdowns; and from metering and regulation station control loops.
1. Many provinces regulate flaring and venting including Alberta (Directive 060) British Columbia (Flaring and Venting Reduction Guideline), and Saskatchewan (S-10 and S-20). Newfoundland & Labrador also has regulations that govern offshore flaring.
Notes
This CEC Fact Sheet was compiled by Ven Venkatachalam and Lennie Kaplan at the Canadian Energy Centre: www.canadianenergycentre.ca. All percentages in this report are calculated from the original data, which can run to multiple decimal points. They are not calculated using the rounded figures that may appear in charts and in the text, which are more reader friendly. Thus, calculations made from the rounded figures (and not the more precise source data) will differ from the more statistically precise percentages we arrive at using source data. The authors and the Canadian Energy Centre would like to thank and acknowledge the assistance of an anonymous reviewer in reviewing the data and research for this Fact Sheet.
References (All links live as of September 23, 2023)
Alberta Energy Regulator (2022), Directive 060: Upstream Petroleum Industry Faring, Incinerating, and Venting <https://bit.ly/3AMYett>; BC Oil and Gas Commission (2021), Flaring and Venting Reduction Guideline, version 5.2 <https://bit.ly/3CWRa0i>; Canada-Newfoundland and Labrador Offshore Petroleum Board (2007), Offshore Newfoundland and Labrador Gas Flaring Reduction <https://bit.ly/3RhKpKu>; D&I Services (2010), Saskatchewan Energy and Resources: S-10 and S-20 <https://bit.ly/3TBrVGJ>; Johnson, Matthew R., and Adam R. Coderre (2012), Compositions and Greenhouse Gas Emission Factors of Flared and Vented Gas in the Western Canadian Sedimentary Basin, Journal of the Air & Waste Management Association 62, 9: 992-1002 <https://bit.ly/3cJRqPd>; Environment Canada (2016), Technical Guidance on Reporting Greenhouse Gas Emissions/Facility Greenhouse Gas Emissions Reporting Program <https://bit.ly/3CVQR5C>; Natural Resources Canada (Undated), Oil Resources <https://bit.ly/3oWWhW0>; U.S. Energy Information Administration (undated), Petroleum and Other Liquids <https://bit.ly/2Ad6S9i>; World Bank (Undated), Global Gas Flaring Data <https://bit.ly/3zXuxGX>.
Alberta
Game changer: Trans Mountain pipeline expansion complete and starting to flow Canada’s oil to the world
Workers complete the “golden weld” of the Trans Mountain pipeline expansion on April 11, 2024 in the Fraser Valley between Hope and Chilliwack, B.C. The project saw mechanical completion on April 30, 2024. Photo courtesy Trans Mountain Corporation
From the Canadian Energy Centre
By Will Gibson
‘We’re going to be moving into a market where buyers are going to be competing to buy Canadian oil’
It is a game changer for Canada that will have ripple effects around the world.
The Trans Mountain pipeline expansion is now complete. And for the first time, global customers can access large volumes of Canadian oil, with the benefits flowing to Canada’s economy and Indigenous communities.
“We’re going to be moving into a market where buyers are going to be competing to buy Canadian oil,” BMO Capital Markets director Randy Ollenberger said recently, adding this is expected to result in a better price for Canadian oil relative to other global benchmarks.
The long-awaited expansion nearly triples capacity on the Trans Mountain system from Edmonton to the West Coast to approximately 890,000 barrels per day. Customers for the first shipments include refiners in China, California and India, according to media reports.
Shippers include all six members of the Pathways Alliance, a group of companies representing 95 per cent of oil sands production that together plan to reduce emissions from operations by 22 megatonnes by 2030 on the way to net zero by 2050.
The first tanker shipment from Trans Mountain’s expanded Westridge Marine Terminal is expected later in May.
 Photo courtesy Trans Mountain Corporation
The new capacity on the Trans Mountain system comes as demand for Canadian oil from markets outside the United States is on the rise.
According to the Canada Energy Regulator, exports to destinations beyond the U.S. have averaged a record 267,000 barrels per day so far this year, up from about 130,000 barrels per day in 2020 and 33,000 barrels per day in 2017.
“Oil demand globally continues to go up,” said Phil Skolnick, New York-based oil market analyst with Eight Capital.
“Both India and China are looking to add millions of barrels a day of refining capacity through 2030.”
In India, refining demand will increase mainly for so-called medium and heavy oil like what is produced in Canada, he said.
“That’s where TMX is the opportunity for Canada, because that’s the route to get to India.”
Led by India and China, oil demand in the Asia-Pacific region is projected to increase from 36 million barrels per day in 2022 to 52 million barrels per day in 2050, according to the U.S. Energy Information Administration.
More oil coming from Canada will shake up markets for similar world oil streams including from Russia, Ecuador, and Iraq, according to analysts with Rystad Energy and Argus Media.
Expanded exports are expected to improve pricing for Canadian heavy oil, which “have been depressed for many years” in part due to pipeline shortages, according to TD Economics.
 Photo courtesy Trans Mountain Corporation
In recent years, the price for oil benchmark Western Canadian Select (WCS) has hovered between $18-$20 lower than West Texas Intermediate (WTI) “to reflect these hurdles,” analyst Marc Ercolao wrote in March.
“That spread should narrow as a result of the Trans Mountain completion,” he wrote.
“Looking forward, WCS prices could conservatively close the spread by $3–4/barrel later this year, which will incentivize production and support industry profitability.”
Canada’s Parliamentary Budget Office has said that an increase of US$5 per barrel for Canadian heavy oil would add $6 billion to Canada’s economy over the course of one year.
The Trans Mountain Expansion will leave a lasting economic legacy, according to an impact assessment conducted by Ernst & Young in March 2023.
In addition to $4.9 billion in contracts with Indigenous businesses during construction, the project leaves behind more than $650 million in benefit agreements and $1.2 billion in skills training with Indigenous communities.
Ernst & Young found that between 2024 and 2043, the expanded Trans Mountain system will pay $3.7 billion in wages, generate $9.2 billion in GDP, and pay $2.8 billion in government taxes.
Construction workers look on at the FortisBC Tilbury LNG expansion project in Delta, B.C., Monday, Nov. 16, 2015. CP Images photo
From the Canadian Energy Centre
Lower costs for natural gas, shipping and liquefaction give Canada an edge in the emerging global LNG market
Worldwide concerns about energy security have put a renewed focus on the international liquefied natural gas (LNG) industry. The global demand for LNG is expected to increase over the next few decades.
Global demand growth will be driven primarily by Asian markets where the need for LNG is expected to increase from 277 million tonnes (MT) in 2025 to 509 MT by 2050 (see Figure 1). By 2050 the demand for LNG in Europe will be 83 MT and in Africa 20 MT. In South America too, demand will increase – from 13 MT in 2025 to 31 MT in 2050.

Source: Derived from Rystad Energy, Gas and LNG Markets Solution.
In North America (Canada, Mexico, and United States) a number of LNG projects that are either under construction or in the planning stages will benefit from the rise in global LNG demand.
North American LNG production is expected to grow from 112 MT in 2025 to over 255 MT by 2050 (see Figure 2). In Canada, the LNG projects under construction or in the planning stages include LNG Canada Phases 1 & 2, Woodfibre LNG, Cedar LNG, the Tilbury LNG expansion, and Ksi Lisims LNG. Canada’s LNG production is expected to grow from just 2 MT in 2025 to over 43 MT by 2050. In the United States production is projected to increase from 108 MT in 2025 to 210 MT in 2050.

Source: Derived from Rystad Energy, Gas and LNG Markets Solution.
This CEC Fact Sheet uses Rystad Energy’s Gas and LNG Markets Solution¹ to benchmark the cost competitiveness of LNG projects that are under construction and proposed in Canada compared to other LNG projects under construction and planned elsewhere in North America. (Note that the content of this report does not represent the views of Rystad Energy.)
The LNG cost competitiveness benchmarking analysis used the following performance metrics:
- LNG plant free-on-board (FOB) cost break-even;
- Total LNG plant cost (for delivery into Asia and Europe).
The objective of this LNG cost competitiveness benchmarking is to compare the competitiveness of Canadian LNG projects against those of major competitors in the United States and Mexico. The selection of other North American LNG facilities for the benchmark comparison with Canadian LNG projects (LNG Canada, the Tilbury LNG Expansion, Woodfibre LNG, Cedar LNG, and Ksi Lisims LNG) is based on the rationale that virtually all Canadian LNG plants are under construction or in the planning stage and that they compare well with other North American LNG plants that are also under construction or are being planned between 2023 and 2050. Further, to assess the cost competitiveness of the various LNG projects more accurately, we chose only North American LNG facilities with sufficient economic data to enable such a comparison. We compared the cost competitiveness of LNG coming from these other North American projects with LNG coming from Canada that is intended to be delivered to markets in Asia and Europe.
1. Rystad Energy is an independent energy research company providing data, analytics, and consultancy services to clients around the globe. Its Gas and LNG Markets Solution provides an overview of LNG markets worldwide. The Solution covers the entire value chain associated with gas and LNG production, country and sector-level demand, and LNG trade flows, infrastructure, economics, costs, and contracts through 2050. It allows for the evaluation of the entire LNG market infrastructure, including future planned projects, as well as the benchmarking of costs for LNG projects (Rystad Energy, 2024).
Comparison of LNG project FOB cost break-even (full cycle)
Figure 3 provides a comparison of the free-on-board (FOB) cost break-even for LNG facilities under construction or being planned in North America. FOB break-even costs include upstream and midstream costs for LNG excluding transportation costs (shipping) as seen from the current year. Break-even prices assume a discount rate of 10 percent and represent the point at which the net present value for an LNG project over a 20- to 30-year period becomes positive, including the payment of capital and operating costs, inclusive of taxes.
Among the selected group of North American LNG projects are Canadian LNG projects with an FOB break-even at the lower end of the range (US$7.18 per thousand cubic feet (kcf)) to those at the higher end (US$8.64 per thousand cubic feet (kcf)).
LNG projects in the United States tend to settle in the middle of the pack, with FOB break-even between US$6.44 per kcf and US$8.37 per kcf.
Mexico LNG projects have the widest variation in costs among the selected group of projects, ranging from US$6.94 per kcf to US$9.44 per kcf (see Figure 3).

Source: Derived from Rystad Energy, Gas and LNG Markets Solution.
Total costs by project for LNG delivery to Asia and Europe
The total cost by LNG plant includes FOB cost break-even, transportation costs, and the regasification tariff. Figure 4 compares total project costs for LNG destined for Asia from selected North American LNG facilities.
Canadian LNG projects are very cost competitive, and those with Asia as their intended market tend to cluster at the lower end of the scale. The costs vary by project, but range between US$8.10 per kcf and US$9.56 per kcf, making Canadian LNG projects among the lowest cost projects in North America.
The costs for Mexico’s LNG projects with Asia as the intended destination for their product tend to cluster in the middle of the pack. Costs among U.S. LNG facilities that plan to send their product to Asia tend to sit at the higher end of the scale, at between US$8.90 and US$10.80 per kcf.

Source: Derived from Rystad Energy, Gas and LNG Markets Solution.
Figure 5 compares total project costs for LNG to be delivered to Europe from select North American LNG facilities.
Costs from U.S. LNG facilities show the widest variation for this market at between US$7.48 per kcf and US$9.42 per kcf, but the majority of U.S. LNG facilities tend to cluster at the lower end of the cost scale, between US$7.48 per kcf and US$8.61 per kcf (see Figure 5).
Canadian projects that intend to deliver LNG to Europe show a variety of costs that tend to cluster at the middle to higher end of the spectrum, ranging from US$9.60 per kcf to and US$11.06 per kcf.
The costs of Mexico’s projects that are aimed at delivering LNG to Europe tend to cluster in the middle of the spectrum (US$9.11 per kcf to US$10.61 per kcf).

Source: Derived from Rystad Energy, Gas and LNG Markets Solution.
Conclusion
LNG markets are complex. Each project is unique and presents its own challenges. The future of Canadian LNG projects depends upon the overall demand and supply in the global LNG market. As the demand for LNG increases in the next decades, the world will be searching for energy security.
The lower liquefaction and shipping costs coupled with the lower cost of the natural gas itself in Western Canada translate into lower prices for Canadian LNG, particularly that destined for Asian markets. Those advantages will help make Canadian LNG very competitive and attractive to markets worldwide.


-
 Brownstone Institute14 hours ago
The Predictable Wastes of Covid Relief
-
 Brownstone Institute17 hours ago
Book Burning Goes Digital
-
 Alberta9 hours ago
Canadian Christian chiropractor fights ‘illegal’ $65,000 fine for refusing to wear mask
-
 Media8 hours ago
CBC tries to hide senior executive bonuses
-
 conflict18 hours ago
Over 200 Days Into War, Family Of American Hostage in Gaza Strives For Deal To Bring Son Home
-
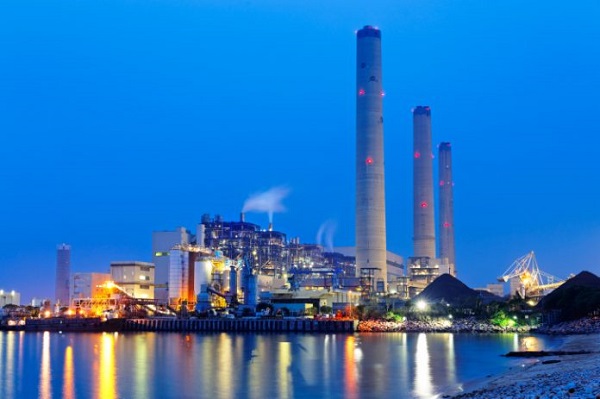 Energy54 mins ago
U.S. EPA Unveils Carbon Dioxide Regulations That Could End Coal and Natural Gas Power Generation
-
 Bruce Dowbiggin12 hours ago
Do It Once, Shame On You; Do It Twice, Shame On Me
-
 Great Reset11 hours ago
All 49 GOP senators call on Biden admin to withdraw support for WHO pandemic treaty