Canadian Energy Centre
Hubs are the future of carbon capture and storage: Why Alberta is an ideal place to make it happen
From the Canadian Energy Centre
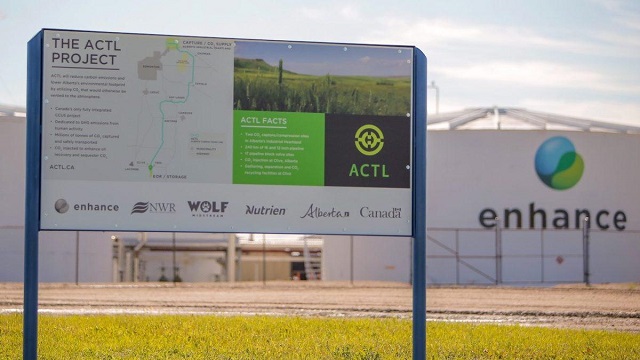
Alberta Carbon Trunk Line a ‘perfect example’ of a successful carbon capture and storage hub in action
Call it a CCS highway – a shared transportation and storage network that enables multiple industrial users to reduce emissions faster.
So-called “hubs” or networks are becoming the leading development strategy for carbon capture and storage (CCS) as the world moves faster to fight climate change, according to the Global CCS Institute.
Alberta, with its large industrial operations and more CO2 storage capacity than Norway, Korea, India, and double the entire Middle East, is an early leader in CCS hub development.
“For Alberta, the concept of CCS hubs makes a lot of sense because you have many industry players that are trying to reduce their emissions, paired with beautiful geological opportunities beneath,” says Beth (Hardy) Valiaho, vice-president with the International CCS Knowledge Centre in Regina, Saskatchewan.
Jarad Daniels, CEO of the Melbourne, Australia-based Global CCS Institute, says that historically, CCS would be a single project integrating a CO2 capture plant with dedicated CO2 compression, pipeline and storage systems.
“Networks, where each entity typically operates only part of the full CCS value chain provide several benefits,” he says.
“They reduce costs and commercial risk by allowing each company to remain focused on their core business.”
The institute, which released its annual global status of CCS report in November, is now tracking more than 100 CCS hubs in development around the world.
Alberta already has one, and Valiaho says it is a “perfect example” of what she likens to on and off-ramps on a CO2 highway.
The Alberta Carbon Trunk Line (ACTL) went into service in 2020 as a shared pipeline taking CO2 captured at two facilities in the Edmonton region to permanent underground storage in a depleted oil field.

Map of the Alberta Carbon Trunk Line system. Courtesy Enhance Energy
So far ACTL has transported more than four million tonnes of CO2 to storage that would have otherwise been emitted to the atmosphere – the equivalent emissions of approximately 900,000 cars.
ACTL was constructed with a “build it and they will come” mentality, Valiaho says. It has enough capacity to transport 14.6 million tonnes of CO2 per year but only uses 1.6 million tonnes of space per year today.
The future-in-mind plan is working. A $1.6 billion net zero hydrogen complex being built by Air Products near Edmonton will have an on-ramp to ACTL when it is up and running later this year.
Air Products will supply hydrogen to a new renewable diesel production plant being built by Imperial Oil. Three million tonnes of CO2 per year are to be captured at the complex and transported for storage by the ACTL Edmonton Connector.
Hub projects like this are important globally, Daniels says, as CCS operations need to dramatically increase from 50 million tonnes of storage per year today to one billion tonnes by 2030 and 10 billion tonnes by 2050.
“It’s clear the development of CCS networks and hubs is critical for achieving the multiple gigatonne levels of deployment all the climate math says is required by mid-century,” he says.
Valiaho says Alberta is an encouraging jurisdiction to develop CCS hubs in part because the government owns the geological pore space where the CO2 is stored, rather than developers having to navigate dealing with multiple resource owners.
“Alberta is a model for the world, and the fact that the government has declared crown ownership of the pore space is very interesting to a lot of international jurisdictions,” she says.
There are 26 CCS storage project proposals under evaluation in Alberta that could be used as shared storage hubs in the future, including the project proposed by the Pathways Alliance of oil sands producers.
If just six of these projects proceed, the Global CCS Institute says they could store a combined 50 million tonnes of CO2 per year, or the equivalent emissions of more than 11 million cars.
Alberta
Game changer: Trans Mountain pipeline expansion complete and starting to flow Canada’s oil to the world
Workers complete the “golden weld” of the Trans Mountain pipeline expansion on April 11, 2024 in the Fraser Valley between Hope and Chilliwack, B.C. The project saw mechanical completion on April 30, 2024. Photo courtesy Trans Mountain Corporation
From the Canadian Energy Centre
By Will Gibson
‘We’re going to be moving into a market where buyers are going to be competing to buy Canadian oil’
It is a game changer for Canada that will have ripple effects around the world.
The Trans Mountain pipeline expansion is now complete. And for the first time, global customers can access large volumes of Canadian oil, with the benefits flowing to Canada’s economy and Indigenous communities.
“We’re going to be moving into a market where buyers are going to be competing to buy Canadian oil,” BMO Capital Markets director Randy Ollenberger said recently, adding this is expected to result in a better price for Canadian oil relative to other global benchmarks.
The long-awaited expansion nearly triples capacity on the Trans Mountain system from Edmonton to the West Coast to approximately 890,000 barrels per day. Customers for the first shipments include refiners in China, California and India, according to media reports.
Shippers include all six members of the Pathways Alliance, a group of companies representing 95 per cent of oil sands production that together plan to reduce emissions from operations by 22 megatonnes by 2030 on the way to net zero by 2050.
The first tanker shipment from Trans Mountain’s expanded Westridge Marine Terminal is expected later in May.
 Photo courtesy Trans Mountain Corporation
The new capacity on the Trans Mountain system comes as demand for Canadian oil from markets outside the United States is on the rise.
According to the Canada Energy Regulator, exports to destinations beyond the U.S. have averaged a record 267,000 barrels per day so far this year, up from about 130,000 barrels per day in 2020 and 33,000 barrels per day in 2017.
“Oil demand globally continues to go up,” said Phil Skolnick, New York-based oil market analyst with Eight Capital.
“Both India and China are looking to add millions of barrels a day of refining capacity through 2030.”
In India, refining demand will increase mainly for so-called medium and heavy oil like what is produced in Canada, he said.
“That’s where TMX is the opportunity for Canada, because that’s the route to get to India.”
Led by India and China, oil demand in the Asia-Pacific region is projected to increase from 36 million barrels per day in 2022 to 52 million barrels per day in 2050, according to the U.S. Energy Information Administration.
More oil coming from Canada will shake up markets for similar world oil streams including from Russia, Ecuador, and Iraq, according to analysts with Rystad Energy and Argus Media.
Expanded exports are expected to improve pricing for Canadian heavy oil, which “have been depressed for many years” in part due to pipeline shortages, according to TD Economics.
 Photo courtesy Trans Mountain Corporation
In recent years, the price for oil benchmark Western Canadian Select (WCS) has hovered between $18-$20 lower than West Texas Intermediate (WTI) “to reflect these hurdles,” analyst Marc Ercolao wrote in March.
“That spread should narrow as a result of the Trans Mountain completion,” he wrote.
“Looking forward, WCS prices could conservatively close the spread by $3–4/barrel later this year, which will incentivize production and support industry profitability.”
Canada’s Parliamentary Budget Office has said that an increase of US$5 per barrel for Canadian heavy oil would add $6 billion to Canada’s economy over the course of one year.
The Trans Mountain Expansion will leave a lasting economic legacy, according to an impact assessment conducted by Ernst & Young in March 2023.
In addition to $4.9 billion in contracts with Indigenous businesses during construction, the project leaves behind more than $650 million in benefit agreements and $1.2 billion in skills training with Indigenous communities.
Ernst & Young found that between 2024 and 2043, the expanded Trans Mountain system will pay $3.7 billion in wages, generate $9.2 billion in GDP, and pay $2.8 billion in government taxes.
Construction workers look on at the FortisBC Tilbury LNG expansion project in Delta, B.C., Monday, Nov. 16, 2015. CP Images photo
From the Canadian Energy Centre
Lower costs for natural gas, shipping and liquefaction give Canada an edge in the emerging global LNG market
Worldwide concerns about energy security have put a renewed focus on the international liquefied natural gas (LNG) industry. The global demand for LNG is expected to increase over the next few decades.
Global demand growth will be driven primarily by Asian markets where the need for LNG is expected to increase from 277 million tonnes (MT) in 2025 to 509 MT by 2050 (see Figure 1). By 2050 the demand for LNG in Europe will be 83 MT and in Africa 20 MT. In South America too, demand will increase – from 13 MT in 2025 to 31 MT in 2050.

Source: Derived from Rystad Energy, Gas and LNG Markets Solution.
In North America (Canada, Mexico, and United States) a number of LNG projects that are either under construction or in the planning stages will benefit from the rise in global LNG demand.
North American LNG production is expected to grow from 112 MT in 2025 to over 255 MT by 2050 (see Figure 2). In Canada, the LNG projects under construction or in the planning stages include LNG Canada Phases 1 & 2, Woodfibre LNG, Cedar LNG, the Tilbury LNG expansion, and Ksi Lisims LNG. Canada’s LNG production is expected to grow from just 2 MT in 2025 to over 43 MT by 2050. In the United States production is projected to increase from 108 MT in 2025 to 210 MT in 2050.

Source: Derived from Rystad Energy, Gas and LNG Markets Solution.
This CEC Fact Sheet uses Rystad Energy’s Gas and LNG Markets Solution¹ to benchmark the cost competitiveness of LNG projects that are under construction and proposed in Canada compared to other LNG projects under construction and planned elsewhere in North America. (Note that the content of this report does not represent the views of Rystad Energy.)
The LNG cost competitiveness benchmarking analysis used the following performance metrics:
- LNG plant free-on-board (FOB) cost break-even;
- Total LNG plant cost (for delivery into Asia and Europe).
The objective of this LNG cost competitiveness benchmarking is to compare the competitiveness of Canadian LNG projects against those of major competitors in the United States and Mexico. The selection of other North American LNG facilities for the benchmark comparison with Canadian LNG projects (LNG Canada, the Tilbury LNG Expansion, Woodfibre LNG, Cedar LNG, and Ksi Lisims LNG) is based on the rationale that virtually all Canadian LNG plants are under construction or in the planning stage and that they compare well with other North American LNG plants that are also under construction or are being planned between 2023 and 2050. Further, to assess the cost competitiveness of the various LNG projects more accurately, we chose only North American LNG facilities with sufficient economic data to enable such a comparison. We compared the cost competitiveness of LNG coming from these other North American projects with LNG coming from Canada that is intended to be delivered to markets in Asia and Europe.
1. Rystad Energy is an independent energy research company providing data, analytics, and consultancy services to clients around the globe. Its Gas and LNG Markets Solution provides an overview of LNG markets worldwide. The Solution covers the entire value chain associated with gas and LNG production, country and sector-level demand, and LNG trade flows, infrastructure, economics, costs, and contracts through 2050. It allows for the evaluation of the entire LNG market infrastructure, including future planned projects, as well as the benchmarking of costs for LNG projects (Rystad Energy, 2024).
Comparison of LNG project FOB cost break-even (full cycle)
Figure 3 provides a comparison of the free-on-board (FOB) cost break-even for LNG facilities under construction or being planned in North America. FOB break-even costs include upstream and midstream costs for LNG excluding transportation costs (shipping) as seen from the current year. Break-even prices assume a discount rate of 10 percent and represent the point at which the net present value for an LNG project over a 20- to 30-year period becomes positive, including the payment of capital and operating costs, inclusive of taxes.
Among the selected group of North American LNG projects are Canadian LNG projects with an FOB break-even at the lower end of the range (US$7.18 per thousand cubic feet (kcf)) to those at the higher end (US$8.64 per thousand cubic feet (kcf)).
LNG projects in the United States tend to settle in the middle of the pack, with FOB break-even between US$6.44 per kcf and US$8.37 per kcf.
Mexico LNG projects have the widest variation in costs among the selected group of projects, ranging from US$6.94 per kcf to US$9.44 per kcf (see Figure 3).

Source: Derived from Rystad Energy, Gas and LNG Markets Solution.
Total costs by project for LNG delivery to Asia and Europe
The total cost by LNG plant includes FOB cost break-even, transportation costs, and the regasification tariff. Figure 4 compares total project costs for LNG destined for Asia from selected North American LNG facilities.
Canadian LNG projects are very cost competitive, and those with Asia as their intended market tend to cluster at the lower end of the scale. The costs vary by project, but range between US$8.10 per kcf and US$9.56 per kcf, making Canadian LNG projects among the lowest cost projects in North America.
The costs for Mexico’s LNG projects with Asia as the intended destination for their product tend to cluster in the middle of the pack. Costs among U.S. LNG facilities that plan to send their product to Asia tend to sit at the higher end of the scale, at between US$8.90 and US$10.80 per kcf.

Source: Derived from Rystad Energy, Gas and LNG Markets Solution.
Figure 5 compares total project costs for LNG to be delivered to Europe from select North American LNG facilities.
Costs from U.S. LNG facilities show the widest variation for this market at between US$7.48 per kcf and US$9.42 per kcf, but the majority of U.S. LNG facilities tend to cluster at the lower end of the cost scale, between US$7.48 per kcf and US$8.61 per kcf (see Figure 5).
Canadian projects that intend to deliver LNG to Europe show a variety of costs that tend to cluster at the middle to higher end of the spectrum, ranging from US$9.60 per kcf to and US$11.06 per kcf.
The costs of Mexico’s projects that are aimed at delivering LNG to Europe tend to cluster in the middle of the spectrum (US$9.11 per kcf to US$10.61 per kcf).

Source: Derived from Rystad Energy, Gas and LNG Markets Solution.
Conclusion
LNG markets are complex. Each project is unique and presents its own challenges. The future of Canadian LNG projects depends upon the overall demand and supply in the global LNG market. As the demand for LNG increases in the next decades, the world will be searching for energy security.
The lower liquefaction and shipping costs coupled with the lower cost of the natural gas itself in Western Canada translate into lower prices for Canadian LNG, particularly that destined for Asian markets. Those advantages will help make Canadian LNG very competitive and attractive to markets worldwide.


Game changer: Trans Mountain pipeline expansion complete and starting to flow Canada’s oil to the world
Canadian Christian chiropractor fights ‘illegal’ $65,000 fine for refusing to wear mask

The Swamp Survived: Why Trump Failed to “Drain the Swamp”

Last Day: What would you do with $20,000 Early Bird Prize?
-
 Fraser Institute2 days ago
Policymakers in Ottawa and Edmonton maintain broken health-care system
-
 COVID-192 days ago
British MP Andrew Bridgen gives powerful speech on ‘scandal’ of excess deaths after COVID jab rollout
-
 Censorship Industrial Complex1 day ago
Elon Musk skewers Trudeau gov’t Online Harms bill as ‘insane’ for targeting speech retroactively
-
 Alberta1 day ago
Parent and gender dysphoria groups granted intervenor status in New Brunswick school policy case
-
 MAiD1 day ago
Even Canadian leftists are starting to recognize the ‘dystopian’ nature of MAiD
-
 Censorship Industrial Complex2 days ago
Internet censorship laws lead a majority of Canadians to believe free speech is threatened: poll
-
 Business1 day ago
Saudis evict locals with lethal force to build ‘green’ city in line with globalist goals: report
-
 Business16 hours ago
Proposed changes to Canada’s Competition Act could kneecap our already faltering economy