Canadian Energy Centre
Why Canadian oil is so important to the United States

From the Canadian Energy Centre
Complementary production in Canada and the U.S. boosts energy security
The United States is now the world’s largest oil producer, but its reliance on oil imports from Canada has never been higher.
Through a vast handshake of pipelines and refineries, Canadian oil and U.S. oil complement each other, strengthening North American energy security.
Here’s why.
Decades in the making
Twenty years ago, the North American energy market looked a lot different than it does today.
In the early 2000s, U.S. oil production had been declining for more than 20 years. By 2005, it dropped to its lowest level since 1949, according to the U.S. Energy Information Administration (EIA).
America’s imports of oil from foreign nations were on the rise.
But then, the first of two powerhouse North American oil plays started ramping up.
In Canada’s oil sands, a drilling technology called SAGD – steam-assisted gravity drainage – unlocked enormous resources that could not be economically produced by the established surface mining processes. And the first new mines in nearly 25 years started coming online.
In about 2010, the second massive play – U.S. light, tight oil – emerged on the scene, thanks to hydraulic fracturing technology.
Oil sands production jumped from about one million barrels per day in 2005 to 2.5 million barrels per day in 2015, reaching an average 3.5 million barrels per day last year, according to the Canada Energy Regulator.
Meanwhile, U.S. oil production skyrocketed from 5.5 million barrels per day in 2005 to 9.4 million barrels per day in 2015 and 13.3 million barrels per day in 2024, according to the EIA.
Together the United States and Canada now produce more oil than anywhere else on earth, according to S&P Global.
As a result, overall U.S. foreign oil imports declined by 35 per cent between 2005 and 2023. But imports from Canada have steadily gone up.
In 2005, Mexico, Saudi Arabia, Venezuela and Nigeria together supplied 52 per cent of U.S. oil imports. Canada was at just 16 per cent.
In 2024, Canada supplied 62 per cent of American oil imports, with Mexico, Saudi Arabia and Venezuela together supplying just 14 per cent, according to the EIA.
“Light” and “heavy” oil

Canadian and U.S. oil production are complementary because they are different from each other in composition.
Canada’s oil exports to the U.S. are primarily “heavy” oil from the oil sands, while U.S. production is primarily “light” oil from the Permian Basin in Texas and New Mexico.
One way to think of it is that heavy oil is thick and does not flow easily, while light oil is thin and flows freely – like orange juice compared to fudge.
The components that make the oil like this require different refinery equipment to generate products including gasoline, jet fuel and base petrochemicals.
Of the oil the U.S. imported from Canada from January to October last year, 75 per cent was heavy, six per cent was light, and the remaining 19 per cent was “medium,” which basically has qualities in between the two.
Tailored for Canadian crude
Many refineries in the United States are specifically designed to process heavy oil, primarily in the U.S. Midwest and U.S. Gulf Coast.
Overall, there are about 130 operable oil refineries in the United States, according to the American Fuel and Petrochemical Manufacturers.
The Alberta Petroleum Marketing Commission (APMC) estimates that 25 consistently use oil from Alberta.
According to APMC, the top five U.S. refineries running the most Alberta crude are:
- Marathon Petroleum, Robinson, Illinois (100% Alberta crude)
- Exxon Mobil, Joliet, Illinois (96% Alberta crude)
- CHS Inc., Laurel, Montana (95% Alberta crude)
- Phillips 66, Billings, Montana (92% Alberta crude)
- Citgo, Lemont, Illinois (78% Alberta crude)
Since 2010, virtually 100 per cent of oil imports to the U.S. Midwest have come from Canada, according to the EIA.
In recent years, new pipeline access and crude-by-rail have allowed more Canadian oil to reach refineries on the U.S. Gulf Coast, rising from about 140,000 barrels per day in 2010 to about 450,000 barrels per day in 2024.
U.S. oil exports
The United States banned oil exports from 1975 to the end of 2015. Since, exports have surged, averaging 4.1 million barrels per day last year, according to the EIA.
That is nearly equivalent to the 4.6 million barrels per day of Canadian oil imported into the U.S. over the same time period, indicating that Canadian crude imports enable sales of U.S. oil to global markets.
Future outlook
Twenty-five years from now, the U.S. will need to import virtually exactly the same amount of oil as it does today (7.0 million barrels per day in 2050 compared to 6.98 million barrels per day in 2023), according to the EIA.
From the Canadian Energy Centre
For Canada, the path to a stronger economy — and stronger global influence — runs through energy.
That’s the view of David Detomasi, a professor at the Smith School of Business at Queen’s University.
Detomasi, author of Profits and Power: Navigating the Politics and Geopolitics of Oil, argues that there is a moral case for developing Canada’s energy, both for Canadians and the world.

David Detomasi. Photo courtesy Smith School of Business, Queen’s University
CEC: What does being an energy superpower mean to you?
DD: It means Canada is strong enough to affect the system as a whole by its choices.
There is something really valuable about Canada’s — and Alberta’s — way of producing carbon energy that goes beyond just the monetary rewards.
CEC: You talk about the moral case for developing Canada’s energy. What do you mean?
DD: I think the default assumption in public rhetoric is that the environmental movement is the only voice speaking for the moral betterment of the world. That needs to be challenged.
That public rhetoric is that the act of cultivating a powerful, effective economic engine is somehow wrong or bad, and that efforts to create wealth are somehow morally tainted.
I think that’s dead wrong. Economic growth is morally good, and we should foster it.
Economic growth generates money, and you can’t do anything you want to do in social expenditures without that engine.
Economic growth is critical to doing all the other things we want to do as Canadians, like having a publicly funded health care system or providing transfer payments to less well-off provinces.
Over the last 10 years, many people in Canada came to equate moral leadership with getting off of oil and gas as quickly as possible. I think that is a mistake, and far too narrow.
Instead, I think moral leadership means you play that game, you play it well, and you do it in our interest, in the Canadian way.
We need a solid base of economic prosperity in this country first, and then we can help others.
CEC: Why is it important to expand Canada’s energy trade?
DD: Canada is, and has always been, a trading nation, because we’ve got a lot of geography and not that many people.
If we don’t trade what we have with the outside world, we aren’t going to be able to develop economically, because we don’t have the internal size and capacity.
Historically, most of that trade has been with the United States. Geography and history mean it will always be our primary trade partner.
But the United States clearly can be an unreliable partner. Free and open trade matters more to Canada than it does to the U.S. Indeed, a big chunk of the American people is skeptical of participating in a global trading system.
As the United States perhaps withdraws from the international trading and investment system, there’s room for Canada to reinforce it in places where we can use our resource advantages to build new, stronger relationships.
One of these is Europe, which still imports a lot of gas. We can also build positive relationships with the enormous emerging markets of China and India, both of whom want and will need enormous supplies of energy for many decades.
I would like to be able to offer partners the alternative option of buying Canadian energy so that they are less reliant on, say, Iranian or Russian energy.
Canada can also maybe eventually help the two billion people in the world currently without energy access.
CEC: What benefits could Canadians gain by becoming an energy superpower?
DD: The first and primary responsibility of our federal government is to look after Canada. At the end of the day, the goal is to improve Canada’s welfare and enhance its sovereignty.
More carbon energy development helps Canada. We have massive debt, an investment crisis and productivity problems that we’ve been talking about forever. Economic and job growth are weak.
Solving these will require profitable and productive industries. We don’t have so many economic strengths in this country that we can voluntarily ignore or constrain one of our biggest industries.
The economic benefits pay for things that make you stronger as a country.
They make you more resilient on the social welfare front and make increasing defence expenditures, which we sorely need, more affordable. It allows us to manage the debt that we’re running up, and supports deals for Canada’s Indigenous peoples.
CEC: Are there specific projects that you advocate for to make Canada an energy superpower?
DD: Canada’s energy needs egress, and getting it out to places other than the United States. That means more transport and port facilities to Canada’s coasts.
We also need domestic energy transport networks. People don’t know this, but a big chunk of Ontario’s oil supply runs through Michigan, posing a latent security risk to Ontario’s energy security.
We need to change the perception that pipelines are evil. There’s a spiderweb of them across the globe, and more are being built.
Building pipelines here, with Canadian technology and know-how, builds our competitiveness and enhances our sovereignty.
Economic growth enhances sovereignty and provides the resources to do other things. We should applaud and encourage it, and the carbon energy sector can lead the way.
From the Canadian Energy Centre
Bigger project maintains decades-long marine safety record
The Trans Mountain system continues its decades-long record of zero marine spills, even as oil tanker traffic has surged more than 800 per cent since the pipeline’s expansion in May 2024.
The number of tankers calling at Trans Mountain’s Westridge Marine Terminal in the Port of Vancouver in one month now rivals the number that used to go through in one year.
A global trend toward safer tanker operations
Trans Mountain’s safe operations are part of a worldwide trend. Global oil tanker traffic is up, yet spills are down, according to the International Tanker Owners Pollution Federation, a London, UK-based nonprofit that provides data and response support.

Graph courtesy International Tanker Owners Pollution Federation
Transport Canada reports a 95 per cent drop in ship-source oil spills and spill volumes since the 1970s, driven by stronger ship design, improved response and better regulations.
“Tankers are now designed much more safely. They are double-hulled and compartmentalized to mitigate spills,” said Mike Lowry, spokesperson for the Western Canada Marine Response Corporation (WCMRC).
WCMRC: Ready to protect the West Coast

One of WCMRC’s new response vessels arrives in Barkley Sound. Photo courtesy Western Canada Marine Response Corporation
From eight marine bases including Vancouver and Prince Rupert, WCMRC stands at the ready to protect all 27,000 kilometres of Canada’s western coastline.
Lowry sees the corporation as similar to firefighters — training to respond to an event they hope they never have to see.
In September, it conducted a large-scale training exercise for a worst-case spill scenario. This included the KJ Gardner — Canada’s largest spill response vessel and a part of WCMRC’s fleet since 2024.
“It’s part of the work we do to make sure everybody is trained and prepared to use our assets just in case,” Lowry said.
Expanding capacity for Trans Mountain

The K.J. Gardner is the largest-ever spill response vessel in Canada. Photo courtesy Western Canada Marine Response Corporation
WCMRC’s fleet and capabilities were doubled with a $170-million expansion to support the Trans Mountain project.
Between 2012 and 2024, the company grew from 13 people and $12 million in assets to more than 200 people and $213 million in assets.
“About 80 per cent of our employees are mariners who work as deckhands, captains and marine engineers on our vessels,” Lowry said.
“Most of the incidents we respond to are small marine diesel spills — the last one was a fuel leak from a forest logging vessel near Nanaimo — so we have deployed our fleet in other ways.”
Tanker safety starts with strong rules and local expertise

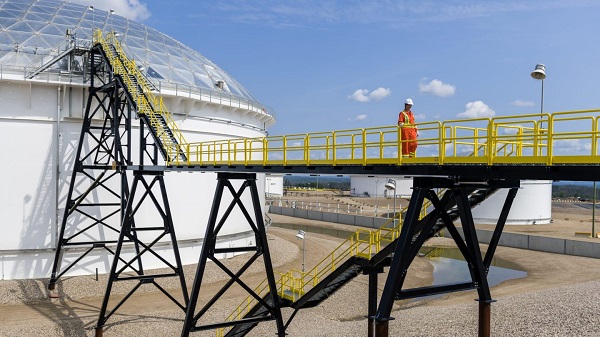
Tanker loading at the Westridge Marine Terminal in the Port of Vancouver. Photo courtesy Trans Mountain Corporation
Speaking on the ARC Energy Ideas podcast, Trans Mountain CEO Mark Maki said tanker safety starts with strong regulations, including the use of local pilots to guide vessels into the harbour.
“On the Mississippi River, you have Mississippi River pilots because they know how the river behaves. Same thing would apply here in Vancouver Harbour. Tides are strong, so people who are familiar with the harbor and have years and decades of experience are making sure the ships go in and out safely,” Maki said.
“A high standard is applied to any ship that calls, and our facility has to meet very strict requirements. And we have rejected ships, just said, ‘Nope, that one doesn’t fit the bill.’ A ship calling on our facilities is very, very carefully looked at.”
![]()
Working with communities to protect sensitive areas
Beyond escorting ships and preparing for spills, WCMRC partners with coastal communities to map sensitive areas that need rapid protection including salmon streams, clam beds and culturally important sites like burial grounds.
“We want to empower communities and nations to be more prepared and involved,” Lowry said.
“They can help us identify and protect the areas that they value or view as sensitive by working with our mapping people to identify those areas in advance. If we know where those are ahead of time, we can develop a protection strategy for them.”


From Exception to Routine. Why Canada’s State-Assisted Suicide Regime Demands a Human-Rights Review

Carney government should privatize airports—then open airline industry to competition
University of Colorado will pay $10 million to staff, students for trying to force them to take COVID shots

Integration Or Indignation: Whose Strategy Worked Best Against Trump?
-
 Automotive1 day ago
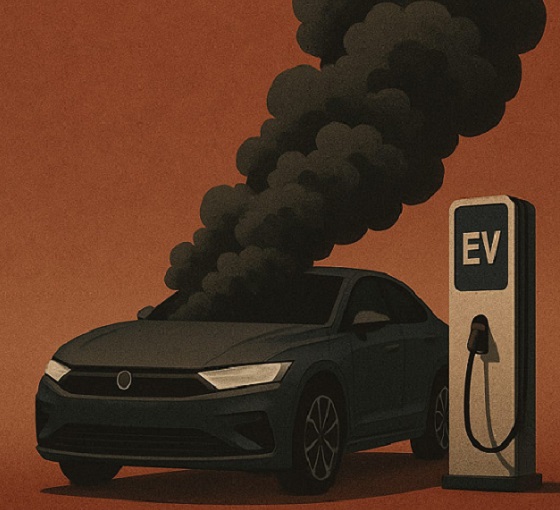
The $50 Billion Question: EVs Never Delivered What Ottawa Promised
-
 Local Business1 day ago
Red Deer Downtown Business Association to Wind Down Operations
-
 International1 day ago
Trump admin wants to help Canadian woman rethink euthanasia, Glenn Beck says
-
 Business2 days ago
Storm clouds of uncertainty as BC courts deal another blow to industry and investment
-
 C2C Journal1 day ago
Wisdom of Our Elders: The Contempt for Memory in Canadian Indigenous Policy
-
 Alberta1 day ago
Alberta introducing three “all-season resort areas” to provide more summer activities in Alberta’s mountain parks
-
 Censorship Industrial Complex1 day ago
Conservative MP calls on religious leaders to oppose Liberal plan to criminalize quoting Scripture
-
 Alberta1 day ago
The case for expanding Canada’s energy exports