Energy
Why Bad Climate Legislation Is Worse Than No Climate Legislation


From Michael Schellenberger
Moderate Democratic Senators Joe Manchin & Krysten Sinema Are Right to Oppose the Clean Energy Performance Program
Progressives are angry that moderate Democratic Senator Joe Machin has reportedly opposed the inclusion of climate-related legislation in President Joe Biden’s budget “This is absolutely the most important climate policy in the package,” said Leah Stokes, a Canadian political scientist who helped write the legislation. “We fundamentally need it to meet our climate goals. That’s just the reality.”
But that’s not the reality. The “Clean Energy Performance Program” is not needed to meet climate goals, and might actually undermine them.
Consider Waxman-Markey. That’s the name of the “cap and trade” climate legislation that passed the House but failed in the Senate in 2010. It had a climate goal of reducing U.S. greenhouse gas emissions by 17 percent below 2005 levels by the year 2020. Instead, the U.S. reduced its emissions by 22 percent.
Had cap and trade legislation passed in the Senate, emissions would have declined less than 22 percent, because Waxman-Markey so heavily subsidized coal and other fossil fuels. As the Los Angeles Times reported at the time, “the Environmental Protection Agency projects that even if the emissions limits go into effect, the U.S. would use more carbon-dioxide-heavy coal in 2020 than it did in 2005.”
The same thing would likely have been true for the Clean Energy Performance Program, which lock in natural gas. Consider France. According to the Commision de Regulation de L’Energie, €29 billion (US$33) billion was used to purchase wind and solar electricity in mainland France between 2009 and 2018. But the money spent on renewables did not lead to cleaner electricity. In fact, the carbon-intensity of French electricity increased.
After years of subsidies for solar and wind, France’s 2017 emissions of 68g/CO2 per kWh was higher than any year between 2012 and 2016. The reason? Record-breaking wind and solar production did not make up for falling nuclear energy output and higher natural gas consumption. And now, the high cost of renewable electricity is showing up in French household electricity bills.
Some pro-nuclear people supported the proposed Clean Energy Performance Program. They claimed it would have saved existing nuclear plants at risk of closure. According to the U.S. Energy Information Administration, the closure of nuclear plants including Diablo Canyon in California, will result in nuclear energy in the U.S. declining by 17% by 2025. If the Program had passed, some pro-nuclear people believe, plants like Diablo Canyon could have been saved.
But the Clean Energy Performance Program would not have saved Diablo Canyon for the same reason it would not have saved Indian Point nuclear plant, which closed in New York, earlier this year: progressive Democratic politicians are forcing nuclear plants to close, and at a very high cost to ratepayers.
If the Clean Energy Performance Program had passed into law, Diablo Canyon’s owner, Pacific Gas & Electric, would simply have passed the $500 million to $1.5 billion penalty imposed by the Program onto ratepayers, along with the other billions in costs related to closing Diablo Canyon 40 years earlier than necessary. The same would have happened with Indian Point.
Where there is political support for saving nuclear plants, state legislators and governors save nuclear plants, as they did in Illinois a few weeks ago, and as they have done in Connecticut, New Jersey, and with up-state nuclear plants in New York. In other states, nuclear plants are protected from cheap natural gas by regulated electricity markets. And now, with natural gas prices rising dramatically, any nuclear plants at risk of closure for economic reasons are no longer at risk.
What threatens the continued operation of nuclear power plants, and nuclear energy in general, is the continued subsidization of renewables, which the Clean Energy Performance Program would have put on steroids. Under the program, utilities would have received $18 for each megawatt-hour of zero-emissions energy it produces between 2023 to 2030, on top of the existing $25 per megawatt-hour subsidy for wind energy.
Under such a scenario, notes energy analyst Robert Bryce, a wind energy company “could earn $43 per megawatt-hour per year for each new megawatt-hour of wind energy it sells. That’s a staggering sum given that the wholesale price of electricity in New York last year was $33 per megawatt-hour. In Texas, the wholesale price of juice was $22 per MWh.”
Manchin is joined in his opposition to the Plan by moderate Democratic Arizona Senator, Krysten Sinema, and understandably so. The legislation would cost Arizona ratepayers nearly $120 billion in additional electricity costs, according to energy analysts Isaac Orr and Mitch Rolling of the American Experiment. “This would result in a 45 percent increase in electricity prices by 2031, compared to 2019 rates,” they note.
As troubling, the Clean Energy Performance Program would increase dependence on solar panels made in China by incarcerated Uighyr Muslims living in concentration camps and against whom the Chinese government is committing “genocide,” according to the U.S. State Department. New research shows that China made solar panels cheaper through the use of forced labor, heavy government subsidies, and some of the dirtiest coal in the world. The Program would have done nothing to shift production of solar panels back to the U.S.
Nor would the legislation have done anything to internalize the high cost of solar panel waste disposal. Most solar panels become hazardous waste, and create dust from heavy metals including lead, as soon as they are removed from rooftops. A major study published in Harvard Business Review earlier this year found that, when the high cost of managing toxic solar panel waste is eventually accounted for, the true cost of solar electricity will rise four-fold.
As troubling, the continued expansion of weather-dependent renewables will increase electricity costs and blackouts across the United States, as they did in California and Texas. Those renewables-driven blackouts were likely on Senator Manchin’s mind when he made his decision to oppose the Clean Energy Performance Plan. He certainly knows about the problems of renewables in Texas and California, since I discussed them directly with Manchin when I testified before his committee earlier this year.
A better approach would be for Congress to seek nuclear-focused legislation to expand nuclear from its current 19% of U.S. electricity to 50% by 2050. It should take as a model the British government’s announcement yesterday that it would put nuclear energy at the center of its climate plans. Global energy shortages triggered by the lack of wind in Europe have led nations to realize that any efforts to decarbonize electricity grids without creating blackouts must center nuclear power, not weather-dependent solar and wind.
Environmental Progress and I met with British lawmakers in 2019 to advocate for a greater focus on nuclear. At the time, many British energy analysts, as well as ostensibly pro-nuclear climate activists, Mark Lynas and George Monbiot, were telling the public that their nation did not need more nuclear, as Britain could simply rely more on wind energy, and natural gas. Now, electricity prices are skyrocketing and factories are closing in Britain, due to a bad year for wind.
It was a strange experience to be alone in Britain, without support from supposedly pro-nuclear Britons, in urging lawmakers to build more nuclear plants, but I was similarly alone in many other parts of the world, and got on with the task. Happily, one year later, former Extinction Rebellion spokesperson Zion Lights joined me in advocating for nuclear, and quickly forced the government to agree to a nuclear build-out.
Today, in the U.S., there is a growing grassroots movement for nuclear energy, one which saved nuclear plants, twice, in Illinois, and other states, and is gearing up to save Diablo Canyon nuclear plant in California. Doing so will require a new governor, since the current one, Gavin Newsom, made closing the plant a feature of his sales pitch to powerful environmental groups, including Sierra Club and Natural Resources Defense Fund which are, like Newsom himself, heavily funded by natural gas and renewable energy companies that stand to benefit from the Diablo’s destruction.
Leadership at the national level will need to come from Senators Manchin and Sinema. While a significant amount of electricity policy is determined by the states, the Senate can play a constructive role in maintaining the reliability, resiliency, affordability, I testified to Senator Manchin and other committee members. Senator Sinema is from Arizona, a state with the largest nuclear plant in the U.S., Palo Verde, and which is a model of how to make electricity both low in emissions, and in costs.
With the Clean Energy Performance Program now apparently dead, the Congress, led by Manchin and Sinema, should take policy action to not only keep operating the nuclear plants that have been critical to preventing power outages in recent years, but also expand them.
About Michael Shellenberger
Michael Shellenberger is a Time Magazine “Hero of the Environment,”Green Book Award winner, and the founder and president of Environmental Progress.
He is author of the best-selling new book, Apocalypse Never (Harper Collins June 30, 2020), which has received strong praise from scientists and scholars. “This may be the most important book on the environment ever written,” wrote climate scientist Tom Wigley. “Apocalypse Never is an extremely important book,” says historian Richard Rhodes, who won the Pulitzer Prize for The Making of the Atomic Bomb. “Within its lively pages, Michael Shellenberger rescues with science and lived experience a subject drowning in misunderstanding and partisanship. His message is invigorating: if you have feared for the planet’s future, take heart.”
Additional Reading:
Why Biden’s Climate Agenda Is Falling Apart
China Made Solar Cheap With Coal, Subsidies, And “Slave” Labor — Not Efficiency
Why Everything They Said About Solar Was Wrong
Energy
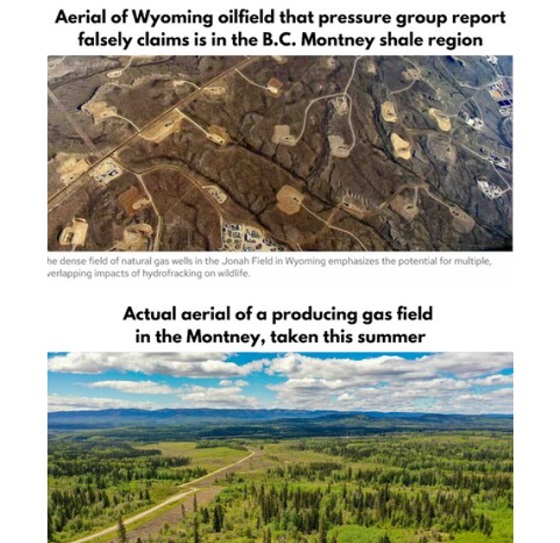
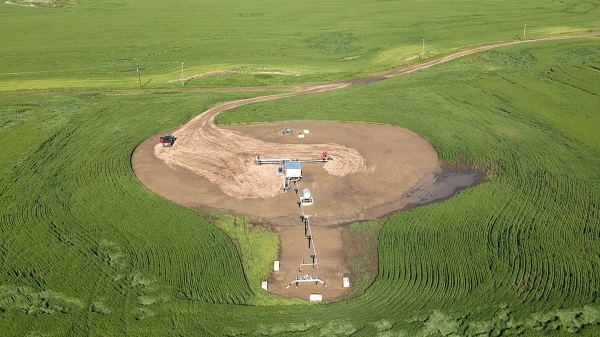
B.C. Residents File Competition Bureau Complaint Against David Suzuki Foundation for Use of False Imagery in Anti-Energy Campaigns
From Energy Now and The Canadian Newswire
A group of eight residents of Northeast British Columbia have filed a formal application for inquiry with Canada’s Competition Bureau, calling for an investigation into the David Suzuki Foundation’s (the Foundation) use of false and misleading imagery in its anti-energy campaigns.
The complaint alleges that the Foundation has repeatedly used a two-decade-old aerial photograph of Wyoming gas wells to falsely depict modern natural gas development in B.C.’s Montney Formation. This area produces roughly half of Canada’s natural gas.
")

Key Facts:
- The misleading image has been used on the Foundation’s website, social media pages, reports and donation appeals.
- The Foundation has acknowledged the image’s true source (Wyoming) in some contexts but has continued to use it to represent B.C. development.
- The residents claim this materially misleads donors and the public, violating Section 74.01(1) of the Competition Act.
- The complaint is filed under Sections 9 and 10 of the Act, asking the Bureau to investigate and impose remedies including ceasing the conduct, publishing corrective notices, and returning proceeds.
Quote from Deena Del Giusto, Spokesperson:
“This is about fairness and truth. The people of Northeast B.C. are proud of the work they do to produce energy for Canada and the world. They deserve honest debate, not scare tactics and misleading imagery used to raise millions in donations. We’re asking the Competition Bureau to hold the David Suzuki Foundation to the same standard businesses face: tell the truth.”
Background:
Natural gas development in the Montney Formation supports thousands of jobs and fuels economic activity across the region. Accurate public information is vital to informed debate, especially as many Canadians live far from production sites.
SOURCE Deena Del Giusto

This article supplied by Troy Media.
U.S. President Donald Trump’s chaotic foreign policy is unravelling years of pressure on Iran and fuelling a surge of Iranian oil into global markets. His recent pivot to allow China to buy Iranian crude, despite previously trying to crush those exports, marks a sharp shift from strategic pressure to transactional diplomacy.
This unpredictability isn’t just confusing allies—it’s transforming global oil flows. One day, Trump vetoes an Israeli plan to assassinate Iran’s supreme leader, Ayatollah Khamenei. Days later, he calls for Iran’s unconditional surrender. After announcing a ceasefire between Iran, Israel and the United States, Trump praises both sides then lashes out at them the next day.
The biggest shock came when Trump posted on Truth Social that “China can now continue to purchase Oil from Iran. Hopefully, they will be purchasing plenty from the U.S., also.” The statement reversed the “maximum pressure” campaign he reinstated in February, which aimed to drive Iran’s oil exports to zero. The campaign reimposes sanctions on Tehran, threatening penalties on any country or company buying Iranian crude,
with the goal of crippling Iran’s economy and nuclear ambitions.
This wasn’t foreign policy—it was deal-making. Trump is brokering calm in the Middle East not for strategy, but to boost American oil sales to China. And in the process, he’s giving Iran room to move.
The effects of this shift in U.S. policy are already visible in trade data. Chinese imports of Iranian crude hit record levels in June. Ship-tracking firm Vortexa reported more than 1.8 million barrels per day imported between June 1 and 20. Kpler data, covering June 1 to 27, showed a 1.46 million bpd average, nearly 500,000 more than in May.
Much of the supply came from discounted May loadings destined for China’s independent refineries—the so-called “teapots”—stocking up ahead of peak summer demand. After hostilities broke out between Iran and Israel on June 12, Iran ramped up exports even further, increasing daily crude shipments by 44 per cent within a week.
Iran is under heavy U.S. sanctions, and its oil is typically sold at a discount, especially to China, the world’s largest oil importer. These discounted barrels undercut other exporters, including U.S. allies and global producers like Canada, reducing global prices and shifting power dynamics in the energy market.
All of this happened with full knowledge of the U.S. administration. Analysts now expect Iranian crude to continue flowing freely, as long as Trump sees strategic or economic value in it—though that position could reverse without warning.
Complicating matters is progress toward a U.S.-China trade deal. Commerce Secretary Howard Lutnick told reporters that an agreement reached in May has now been finalized. China later confirmed the understanding. Trump’s oil concession may be part of that broader détente, but it comes at the cost of any consistent pressure on Iran.
Meanwhile, despite Trump’s claims of obliterating Iran’s nuclear program, early reports suggest U.S. strikes merely delayed Tehran’s capabilities by a few months. The public posture of strength contrasts with a quieter reality: Iranian oil is once again flooding global markets.
With OPEC+ also boosting output monthly, there is no shortage of crude on the horizon. In fact, oversupply may once again define the market—and Trump’s erratic diplomacy is helping drive it.
For Canadian producers, especially in Alberta, the return of cheap Iranian oil can mean downward pressure on global prices and stiffer competition in key markets. And with global energy supply increasingly shaped by impulsive political decisions, Canada’s energy sector remains vulnerable to forces far beyond its borders.
This is the new reality: unpredictability at the top is shaping the oil market more than any cartel or conflict. And for now, Iran is winning.
Toronto-based Rashid Husain Syed is a highly regarded analyst specializing in energy and politics, particularly in the Middle East. In addition to his contributions to local and international newspapers, Rashid frequently lends his expertise as a speaker at global conferences. Organizations such as the Department of Energy in Washington and the International Energy Agency in Paris have sought his insights on global energy matters.
Troy Media empowers Canadian community news outlets by providing independent, insightful analysis and commentary. Our mission is to support local media in helping Canadians stay informed and engaged by delivering reliable content that strengthens community connections and deepens understanding across the country.


New Peer-Reviewed Study Affirms COVID Vaccines Reduce Fertility

Ottawa Funded the China Ferry Deal—Then Pretended to Oppose It
The permanent CO2 storage site at the end of the Alberta Carbon Trunk Line is just getting started

Canada’s euthanasia regime is not health care, but a death machine for the unwanted
-
 Alberta12 hours ago
Alberta Independence Seekers Take First Step: Citizen Initiative Application Approved, Notice of Initiative Petition Issued
-
 Crime11 hours ago
National Health Care Fraud Takedown Results in 324 Defendants Charged in Connection with Over $14.6 Billion in Alleged Fraud
-
 Health10 hours ago
RFK Jr. Unloads Disturbing Vaccine Secrets on Tucker—And Surprises Everyone on Trump
-
 Bruce Dowbiggin13 hours ago
The Game That Let Canadians Forgive The Liberals — Again
-
 Alberta1 day ago
COVID mandates protester in Canada released on bail after over 2 years in jail
-
 Crime2 days ago
Project Sleeping Giant: Inside the Chinese Mercantile Machine Linking Beijing’s Underground Banks and the Sinaloa Cartel
-
 Business1 day ago
Canada’s loyalty to globalism is bleeding our economy dry
-
 Alberta2 days ago
Alberta uncorks new rules for liquor and cannabis