Canadian Energy Centre
The importance of Canadian crude oil to refineries in the U.S.

From the Canadian Energy Centre
By Ven VenkatachalamOil from Canada supplies more than 23% of U.S. refinery feedstock, helping bolster North American energy security
Introduction
The refining industry¹ in the United States is one of the world’s largest, with capacity to process 18 million barrels of oil per day. Canada plays a crucial role by supplying more than one-fifth of the crude oil refined in the U.S.
The U.S.–Canada cross-border crude oil trade is essential to North American energy security. Canadian crude oil exports and the U.S. refinery industry are highly integrated. In recent years, Canada’s crude oil sector has been making a growing contribution to the operations of U.S. oil refineries.
U.S. refineries are converting Canadian crude oil, including heavy oil,² into products that North Americans use daily, such as transportation fuels (gasoline and diesel), chemicals, and plastics. Although the U.S. has increased its production of oil in recent years, U.S. refineries still rely on Canadian heavy crude oil to meet their feedstock (i.e., the raw materials and intermediate materials processed at refineries to produce finished petroleum products, otherwise known as refinery inputs) specifications.
In this CEC Fact Sheet, we examine several economic indicators that illustrate the importance of Canadian crude oil, particularly heavy crude, to U.S. refineries. This fact sheet also analyzes the refining industry’s direct and indirect economic impacts on the U.S. economy.
1. NAICS Code 324110 (Petroleum Refineries): This industry comprises
establishments primarily engaged in refining crude petroleum into refined petroleum.
2. A majority of the crude oil imported by the U.S. from Canada is heavy crude (between 15-25 API gravity). API gravity is a commonly used index for measuring the density of crude oil or refined products. Crude oil typically has an API between 15 and 45 degrees. The higher the API, the lighter the crude; the lower the API, the heavier the crude.
Imports of Canadian crude oil to refineries in the United States
The physical characteristics of crude oil determine how it is processed in refineries. Generally, heavy crude oil offers higher yields of low-value products (coke and asphalt) and lower yields of high-value products (gasoline). Heavy crude oil requires more complicated processing than lighter crude if it is to produce high-value products.
Overall, Canadian crude oil imports to U.S. refineries for processing have risen from over 1.3 million barrels per day in 2000 to just under 3.8 million barrels per day in 2022, an increase of 181 per cent (see Figure 1). The per cent of Canadian crude in U.S. refinery feedstock has steadily risen from nearly 9 per cent in 2000 to over 23 per cent by the end of 2022.

Source: U.S. Energy Information Administration (2024a, 2024b, 2024c)
The U.S. refining industry
Since the first U.S. refinery began operating in 1861, the refining industry has been one of the largest manufacturing sectors in the United States. There are currently 129 petroleum refineries across the five U.S. PADDS³ (125 operating refineries and five refineries that are idle but not permanently shut down) (see Table 1).
3. The United States is divided into five Petroleum Administration for Defense
Districts (PADDs) for the allocation of fuels derived from petroleum products,
including gasoline and diesel fuel. The geographic breakdown of PADDs enables
U.S. policymakers to better analyze petroleum supplies in the country

Source: U.S. Energy Information Administration (2023)
Total refining capacity in the United States has risen from 16.2 million barrels of crude processed in 2000 to nearly 17.8 million barrels per day in 2022, an increase of over 8 per cent (see Figure 2). The refining utilization⁴ has also recovered, growing from 79 per cent during COVID-19 to a high of 91 per cent in 2022.

Source: U.S. Energy Information Administration (2024b)
The impact of the U.S. refining industry on the American economy
The estimated direct and indirect economic impacts of the U.S. refining industry in 2024 include 1.6 million direct and indirect jobs, $206 billion in labour income, $577 billion in direct and indirect value-added, and $1.6 trillion in what is known as “outputs,” i.e., the value of goods and services produced by the industry (see Table 2).⁵
4. Capacity measures how much crude oil refineries are able to process.
Utilization measures how much is actually being processed (as a percentage of
maximum capacity).
5. These projected amounts are in nominal U.S. dollars

Source: Author’s calculations using the IMPLAN modelling system. Details may not add up to totals due to rounding
Projected spending by the U.S. refining industry, 2024-2030
Figure 3 illustrates the industry’s projected annual spending between 2024 and 2030. Industry spending is expected to be US$58 billion in 2024, rising to US$62 billion by 2030. This includes operating expenditures (OPEX) and capital expenditures (CAPEX). Cumulatively, between 2024 and 2030, the industry is projected to spend over US$428 billion.⁶
6. These projected amounts are in nominal U.S. dollars and are calculated using
the Rystad Energy UCube.

Source: Derived from Rystad Energy (2024), Service Market Solution
Conclusion
American refineries are critical to the country’s strategic interest. U.S. refineries are projected to spend more than $428 billion in the next seven years on operating and capital expenditures. The industries support millions of jobs. Canadian crude is an important part of the equation. It supplies more than 23 per cent of U.S. refinery feedstock.
Not only are Canadian crude oil supplies critical for the U.S. refining industry, but they are key to North American energy security. Limiting access to Canadian crude oil for U.S. refineries would require increased U.S. imports from less-free countries, which in turn would risk North American energy security.
References
Rystad Energy (2024), Service Market Solution <http://tinyurl.com/28fmv6a6>; U.S. Energy Information Administration (Undated), Oil and Petroleum Products Explained: Refining Crude Oil <http://tinyurl.com/3b2uwrxh>; U.S. Energy Information Administration (2023), Refinery Capacity Report <http://tinyurl.com/2s4ybz9z>; U.S. Energy Information Administration (2024a), Petroleum and Other Liquids: PADD District Imports by Country of Origin <http://tinyurl.com/58mzvtts>; U.S. Energy Information Administration (2024b), Petroleum and Other Liquids: Refinery Utilization and Capacity <http://tinyurl.com/3wx957k4>; U.S. Energy Information Administration (2024c), Petroleum and Other Liquids: U.S. Imports by Country of Origin <http://tinyurl.com/bdcsbwhn>; U.S. Environmental Protection Agency (Undated), Appendix A — Overview of Petroleum Refining, Proposed Clean Fuels Refinery DEIS <http://tinyurl.com/dveyzc8k>.
From the Canadian Energy Centre
By Cody Ciona
‘Alberta has never seen this level and volume of load connection requests’
Billions of investment in new data centres is still expected in Alberta despite the province’s electric system operator placing a temporary limit on new large-load grid connections, said Carson Kearl, lead data centre analyst for Enverus Intelligence Research.
Kearl cited NVIDIA CEO Jensen Huang’s estimate from earlier this year that building a one-gigawatt data centre costs between US$60 billion and US$80 billion.
That implies the Alberta Electric System Operator (AESO)’s 1.2 gigawatt temporary limit would still allow for up to C$130 billion of investment.
“It’s got the potential to be extremely impactful to the Alberta power sector and economy,” Kearl said.
Importantly, data centre operators can potentially get around the temporary limit by ‘bringing their own power’ rather than drawing electricity from the existing grid.
In Alberta’s deregulated electricity market – the only one in Canada – large energy consumers like data centres can build the power supply they need by entering project agreements directly with electricity producers.
According to the AESO, there are 30 proposed data centre projects across the province.
The total requested power load for these projects is more than 16 gigawatts, roughly four gigawatts more than Alberta’s demand record in January 2024 during a severe cold snap.
For comparison, Edmonton’s load is around 1.4 gigawatts, the AESO said.
“Alberta has never seen this level and volume of load connection requests,” CEO Aaron Engen said in a statement.
“Because connecting all large loads seeking access would impair grid reliability, we established a limit that preserves system integrity while enabling timely data centre development in Alberta.”
As data centre projects come to the province, so do jobs and other economic benefits.
“You have all of the construction staff associated; electricians, engineers, plumbers, and HVAC people for all the cooling tech that are continuously working on a multi-year time horizon. In the construction phase there’s a lot of spend, and that is just generally good for the ecosystem,” said Kearl.
Investment in local power infrastructure also has long-term job implications for maintenance and upgrades, he said.
“Alberta is a really exciting place when it comes to building data centers,” said Beacon AI CEO Josh Schertzer on a recent ARC Energy Ideas podcast.
“It has really great access to natural gas, it does have some excess grid capacity that can be used in the short term, it’s got a great workforce, and it’s very business-friendly.”
The unaltered reproduction of this content is free of charge with attribution to the Canadian Energy Centre.
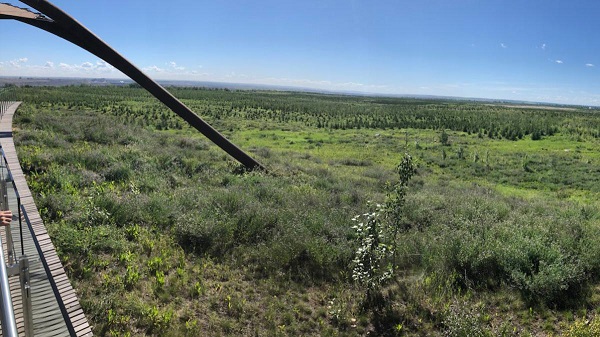
Wapisiw Lookout, reclaimed site of the oil sands industry’s first tailings pond, which started in 1967. The area was restored to a solid surface in 2010 and now functions as a 220-acre watershed. Photo courtesy Suncor Energy
From the Canadian Energy Centre
By CEC Research
Mines demonstrate significant strides through technological innovation
Tailings are a byproduct of mining operations around the world.
In Alberta’s oil sands, tailings are a fluid mixture of water, sand, silt, clay and residual bitumen generated during the extraction process.
Engineered basins or “tailings ponds” store the material and help oil sands mining projects recycle water, reducing the amount withdrawn from the Athabasca River.
In 2023, 79 per cent of the water used for oil sands mining was recycled, according to the latest data from the Alberta Energy Regulator (AER).
Decades of operations, rising production and federal regulations prohibiting the release of process-affected water have contributed to a significant accumulation of oil sands fluid tailings.
The Mining Association of Canada describes that:
“Like many other industrial processes, the oil sands mining process requires water.
However, while many other types of mines in Canada like copper, nickel, gold, iron ore and diamond mines are allowed to release water (effluent) to an aquatic environment provided that it meets stringent regulatory requirements, there are no such regulations for oil sands mines.
Instead, these mines have had to retain most of the water used in their processes, and significant amounts of accumulated precipitation, since the mines began operating.”
Despite this ongoing challenge, oil sands mining operators have made significant strides in reducing fluid tailings through technological innovation.
This is demonstrated by reductions in “legacy fluid tailings” since 2015.
Legacy Fluid Tailings vs. New Fluid Tailings
As part of implementing the Tailings Management Framework introduced in March 2015, the AER released Directive 085: Fluid Tailings Management for Oil Sands Mining Projects in July 2016.
Directive 085 introduced new criteria for the measurement and closure of “legacy fluid tailings” separate from those applied to “new fluid tailings.”
Legacy fluid tailings are defined as those deposited in storage before January 1, 2015, while new fluid tailings are those deposited in storage after January 1, 2015.
The new rules specified that new fluid tailings must be ready to reclaim ten years after the end of a mine’s life, while legacy fluid tailings must be ready to reclaim by the end of a mine’s life.
Total Oil Sands Legacy Fluid Tailings

Alberta’s oil sands mining sector decreased total legacy fluid tailings by approximately 40 per cent between 2015 and 2024, according to the latest company reporting to the AER.
Total legacy fluid tailings in 2024 were approximately 623 million cubic metres, down from about one billion cubic metres in 2015.
The reductions are led by the sector’s longest-running projects: Suncor Energy’s Base Mine (opened in 1967), Syncrude’s Mildred Lake Mine (opened in 1978), and Syncrude’s Aurora North Mine (opened in 2001). All are now operated by Suncor Energy.
The Horizon Mine, operated by Canadian Natural Resources (opened in 2009) also reports a significant reduction in legacy fluid tailings.
The Muskeg River Mine (opened in 2002) and Jackpine Mine (opened in 2010) had modest changes in legacy fluid tailings over the period. Both are now operated by Canadian Natural Resources.
Imperial Oil’s Kearl Mine (opened in 2013) and Suncor Energy’s Fort Hills Mine (opened in 2018) have no reported legacy fluid tailings.
Suncor Energy Base Mine

Between 2015 and 2024, Suncor Energy’s Base Mine reduced legacy fluid tailings by approximately 98 per cent, from 293 million cubic metres to 6 million cubic metres.
Syncrude Mildred Lake Mine

Between 2015 and 2024, Syncrude’s Mildred Lake Mine reduced legacy fluid tailings by approximately 15 per cent, from 457 million cubic metres to 389 million cubic metres.
Syncrude Aurora North Mine

Between 2015 and 2024, Syncrude’s Aurora North Mine reduced legacy fluid tailings by approximately 25 per cent, from 102 million cubic metres to 77 million cubic metres.
Canadian Natural Resources Horizon Mine

Between 2015 and 2024, Canadian Natural Resources’ Horizon Mine reduced legacy fluid tailings by approximately 36 per cent, from 66 million cubic metres to 42 million cubic metres.
Total Oil Sands Fluid Tailings
Reducing legacy fluid tailings has helped slow the overall growth of fluid tailings across the oil sands sector.
Without efforts to reduce legacy fluid tailings, the total oil sands fluid tailings footprint today would be approximately 1.6 billion cubic metres.
The current fluid tailings volume stands at approximately 1.2 billion cubic metres, up from roughly 1.1 billion in 2015.

The unaltered reproduction of this content is free of charge with attribution to the Canadian Energy Centre.


Before Trudeau average annual immigration was 617,800. Under Trudeau number skyrocketted to 1.4 million annually

FDA requires new warning on mRNA COVID shots due to heart damage in young men

Canada’s euthanasia regime is already killing the disabled. It’s about to get worse

Blackouts Coming If America Continues With Biden-Era Green Frenzy, Trump Admin Warns
-
Fraser Institute1 day ago
Before Trudeau average annual immigration was 617,800. Under Trudeau number skyrocketted to 1.4 million annually
-
MAiD1 day ago
Canada’s euthanasia regime is already killing the disabled. It’s about to get worse
-
 Frontier Centre for Public Policy1 day ago
New Book Warns The Decline In Marriage Comes At A High Cost
-
 Business1 day ago
Prime minister can make good on campaign promise by reforming Canada Health Act
-
 Addictions1 day ago
‘Over and over until they die’: Drug crisis pushes first responders to the brink
-
 International1 day ago
Chicago suburb purchases childhood home of Pope Leo XIV
-
 Daily Caller1 day ago
USAID Quietly Sent Thousands Of Viruses To Chinese Military-Linked Biolab
-
 Energy1 day ago
LNG Export Marks Beginning Of Canadian Energy Independence