Economy
Taxpayers Federation: Canada’s largest city overpaying for construction $350 million a year
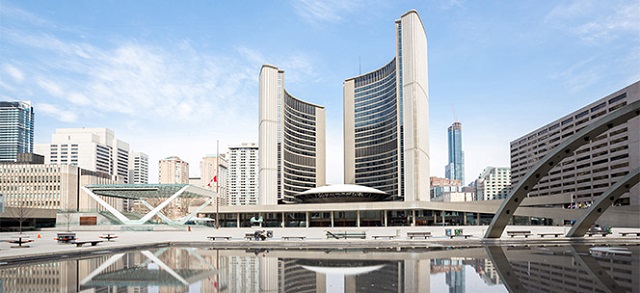
From the Canadian Taxpayers Federation
Author: Jay Goldberg
Favouring unions costs taxpayers dearly
They say less is more, especially when it comes to budgeting. Apparently, Toronto Mayor Olivia Chow never got the memo.
Canada’s largest city keeps overpaying on construction projects, to the tune of $350 million a year. The reason, in many cases, is that only union-affiliated firms need apply.
With modest construction contracting reform, Toronto could save a bundle and see property taxes frozen for 2025.
Over the past two years, Toronto politicians voted to increase property taxes by a whopping 18 per cent. Last year’s increase alone was 9.5 per cent.
Because of these massive property tax increases, many families were pushed to the brink.
Property tax bills for most Torontonians soared by hundreds of dollars over the past two years.
Yet so much of this pain could have been avoided with a little common-sense policymaking.
Would you refuse to even consider quotes from a non-unionized company? Or would you get quotes from everyone and then make your decision?
To nearly everyone on the planet other than Toronto’s zany politicians, the choice is obvious.
But when you’re a Toronto politician spending other people’s money, apparently open competition to find the best deal isn’t a priority.
Right now, Toronto uses a closed-tendering approach to award contracts for some of the city’s most expensive construction projects. That means only a handful of companies associated with a small group of unions can bid on those jobs.
Cardus, a non-partisan thinktank, released a report last year projecting Toronto was poised to award $1.7 billion in construction projects through a closed tendering process in 2023. Because Toronto only allows a small number of unionized construction companies to bid on those jobs, the cost goes up.
In fact, Cardus estimated Toronto taxpayers were set to overpay on construction projects in 2023 to the tune of $350 million due to a lack of competition.
Closed tendering used to be the norm in Ontario. Every city across the province overpaid on construction projects to cater to big unions.
That all changed in 2019, when the Ford government passed legislation allowing municipalities to open up the construction contracting process to real competition.
Sadly, Toronto has thus far chosen not to take advantage of the Ford government’s legislative reforms to save a boatload of cash.
But nearby cities sure have.
Consider the example of Hamilton.
Hamilton was one of the first cities in Ontario to take advantage of the Ford government’s reforms. Cardus estimates Hamilton is saving 21 per cent on its construction projects because the city opened up its contracting process. This single reform did a great deal to improve the city’s bottom line.
Yet Toronto politicians appear stuck in the past. During last year’s mayoral by-election, only two candidates, Councillor Brad Bradford and Anthony Furey, pledged to follow Hamilton in reforming construction contracts.
There has been no indication from Chow, who won that by-election, that this common-sense reform is even on the table.
Last year, Chow and council increased property taxes by 9.5 per cent, the highest property tax hike in Toronto’s history.
Had Chow implemented construction reform and saved the $350 million Cardus pointed to, last year’s property tax increase could have been wiped out entirely.
Think about that. Chow had a choice: save money through competitive bidding or hammer taxpayers with a huge tax hike.
The mayor picked the tax hike.
To break the cycle of massive property tax hikes, it’s high time Toronto looked at construction contract reform.
Taxpayers shouldn’t put up with politicians overpaying on construction contracts to the tune of hundreds of millions of dollars a year, only to see those same politicians turn around and impose record property tax hikes.
This isn’t just a problem restricted to Toronto: taxpayers from British Columbia to Quebec themselves face similar anti-competitive policies at the provincial level.
It’s time for politicians to put taxpayers, not unions, first.
Chow should implement common-sense construction contracting reforms to head off a massive property tax increase in 2025.
Automotive
Federal government should swiftly axe foolish EV mandate

From the Fraser Institute
Two recent events exemplify the fundamental irrationality that is Canada’s electric vehicle (EV) policy.
First, the Carney government re-committed to Justin Trudeau’s EV transition mandate that by 2035 all (that’s 100 per cent) of new car sales in Canada consist of “zero emission vehicles” including battery EVs, plug-in hybrid EVs and fuel-cell powered vehicles (which are virtually non-existent in today’s market). This policy has been a foolish idea since inception. The mass of car-buyers in Canada showed little desire to buy them in 2022, when the government announced the plan, and they still don’t want them.
Second, President Trump’s “Big Beautiful” budget bill has slashed taxpayer subsidies for buying new and used EVs, ended federal support for EV charging stations, and limited the ability of states to use fuel standards to force EVs onto the sales lot. Of course, Canada should not craft policy to simply match U.S. policy, but in light of policy changes south of the border Canadian policymakers would be wise to give their own EV policies a rethink.
And in this case, a rethink—that is, scrapping Ottawa’s mandate—would only benefit most Canadians. Indeed, most Canadians disapprove of the mandate; most do not want to buy EVs; most can’t afford to buy EVs (which are more expensive than traditional internal combustion vehicles and more expensive to insure and repair); and if they do manage to swing the cost of an EV, most will likely find it difficult to find public charging stations.
Also, consider this. Globally, the mining sector likely lacks the ability to keep up with the supply of metals needed to produce EVs and satisfy government mandates like we have in Canada, potentially further driving up production costs and ultimately sticker prices.
Finally, if you’re worried about losing the climate and environmental benefits of an EV transition, you should, well, not worry that much. The benefits of vehicle electrification for climate/environmental risk reduction have been oversold. In some circumstances EVs can help reduce GHG emissions—in others, they can make them worse. It depends on the fuel used to generate electricity used to charge them. And EVs have environmental negatives of their own—their fancy tires cause a lot of fine particulate pollution, one of the more harmful types of air pollution that can affect our health. And when they burst into flames (which they do with disturbing regularity) they spew toxic metals and plastics into the air with abandon.
So, to sum up in point form. Prime Minister Carney’s government has re-upped its commitment to the Trudeau-era 2035 EV mandate even while Canadians have shown for years that most don’t want to buy them. EVs don’t provide meaningful environmental benefits. They represent the worst of public policy (picking winning or losing technologies in mass markets). They are unjust (tax-robbing people who can’t afford them to subsidize those who can). And taxpayer-funded “investments” in EVs and EV-battery technology will likely be wasted in light of the diminishing U.S. market for Canadian EV tech.
If ever there was a policy so justifiably axed on its failed merits, it’s Ottawa’s EV mandate. Hopefully, the pragmatists we’ve heard much about since Carney’s election victory will acknowledge EV reality.
Economy
The stars are aligning for a new pipeline to the West Coast
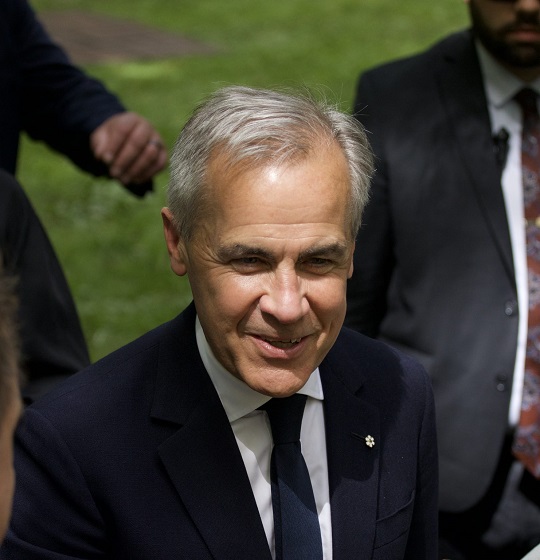
From Resource Works
Mark Carney says another pipeline is “highly likely”, and that welcome news.
While attending this year’s Calgary Stampede, Prime Minister Mark Carney made it official that a new pipeline to Canada’s West Coast is “highly likely.”
While far from a guarantee, it is still great news for Canada and our energy industry. After years of projects being put on hold or cancelled, things are coming together at the perfect time for truly nation-building enterprises.
Carney’s comments at Stampede have been preceded by a number of other promising signs.
At a June meeting between Carney and the premiers in Saskatoon, Alberta Premier Danielle Smith proposed a “grand bargain” that would include a privately funded pipeline capable of moving a million barrels of oil a day, along with significant green investments.
Carney agreed with Smith’s plan, saying that Canada needed to balance economic growth with environmental responsibility.
Business and political leaders have been mostly united in calling for the federal government to speed up the building of pipelines, for economic and strategic reasons. As we know, it is very difficult to find consensus in Canada, with British Columbia Premier David Eby still reluctant to commit to another pipeline on the coast of the province.
Alberta has been actively encouraging support from the private sector to fund a new pipeline that would fulfil the goals of the Northern Gateway project, a pipeline proposed in 2008 but snuffed out by a hail of regulations under former Prime Minister Justin Trudeau.
We are in a new era, however, and we at Resource Works remarked that last month’s G7 meeting in Kananaskis could prove to be a pivotal moment in the history of Canadian energy. An Ipsos poll found that Canada was the most favoured nation for supplying oil in the G7, and our potential as an energy superpower has never been more important for the democratic world, given the instability caused by Russia and other autocratic energy powers.
Because of this shifting, uncertain global climate, Canadian oil and gas are more attractive than ever, and diversifying our exports beyond the United States has become a necessity in the wake of Donald Trump’s regime of tariffs on Canada and other friendly countries.
It has jolted Canadian political leaders into action, and the premiers are all on board with strengthening our economic independence and trade diversification, even if not all agree on what that should look like.
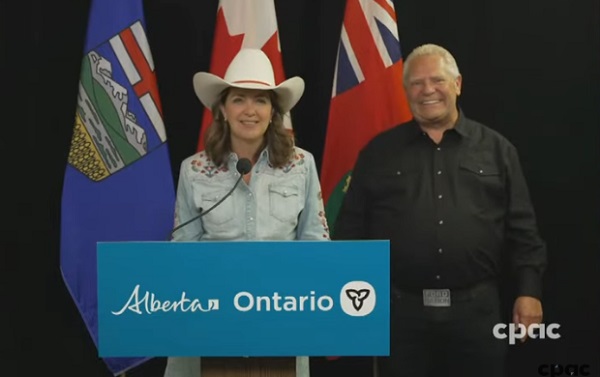
Two premiers who have found common ground are Danielle Smith and Ontario Premier Doug Ford. After meeting at Stampede, the pair signed two memorandums of understanding to collaborate on studying an energy corridor and other infrastructure to boost interprovincial trade. This included the possibility of an eastward-bound pipeline to Ontario ports for shipping abroad.
Ford explicitly said that “the days of relying on the United States 100 percent, those days are over.” That’s in line with Alberta’s push for new pipeline routes, especially to northwestern B.C., which are supported by Smith’s government.
On June 10, Resource Works founder and CEO Stewart Muir wrote that Canadian energy projects are a daunting endeavour, akin to a complicated jigsaw puzzle, but that getting discouraged by the complexity causes us to lose sight of the picture itself. He asserted that Canadians have to accept that messiness, not avoid it.
Prime Minister Carney has suggested he will make adjustments to existing regulations and controversial legislation like Bill C-69 and the emissions cap, all of which have slowed the development of new energy infrastructure.
This moment of alignment between Ottawa, the provinces, and other stakeholders cannot be wasted. The stars are aligning, and it will be a tragedy if we cannot take a great step into the future of our country.
-
 Indigenous2 days ago
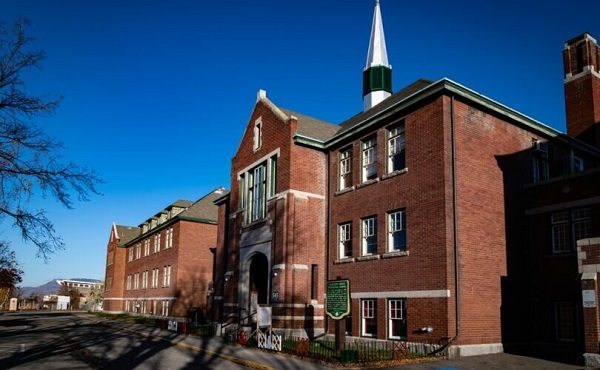
Internal emails show Canadian gov’t doubted ‘mass graves’ narrative but went along with it
-

 Bruce Dowbiggin2 days ago
Eau Canada! Join Us In An Inclusive New National Anthem
-
 Crime2 days ago
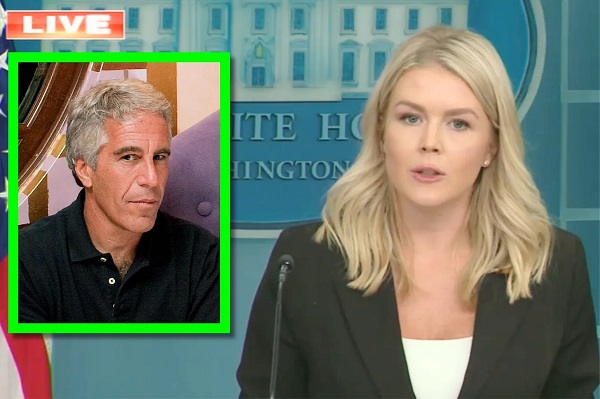
Eyebrows Raise as Karoline Leavitt Answers Tough Questions About Epstein
-

 Business2 days ago
Carney’s new agenda faces old Canadian problems
-
 Alberta2 days ago
Alberta and Ontario sign agreements to drive oil and gas pipelines, energy corridors, and repeal investment blocking federal policies
-

 Alberta2 days ago
COWBOY UP! Pierre Poilievre Promises to Fight for Oil and Gas, a Stronger Military and the Interests of Western Canada
-

 Crime1 day ago
“This is a total fucking disaster”
-

 International1 day ago
Chicago suburb purchases childhood home of Pope Leo XIV


