Opinion
It is time that the school boards are held accountable for discriminatory practices.


Recently, the province stepped up and provided funding for the expansion on St. Patrick’s school in Highland Green, just north of the river. The school’s enrolment was 30% over capacity, a kindergarten class was being taught in a hallway, and students and families were paying the price.
Further to the north at Johnstone Park, a school destined for an 8 acre site, there was switched to a site south of the river and the 8 acre site was turned into a park.
There has not been a school built north of the river since 1985, perhaps that could explainwhy schools are at 130% capacity and classes are held in hallways. There is no high schools north of the river, even though up to 40% of the population resided there. Could be why 777 more residents moved out of the north side and out of the city than moved into the area. Remember there are 4 high schools south of the river with 2 more planned. There are no high schools planned for the north side of the river even with thousands of acres north of 11a coming up for development and 25,000 more residents planned.
The Ministry of Education says they follow the direction of the local school boards.
What do the school board trustees, past and present have to say? Well I have been told that they build where city tells them they can build. The city, apparently, decided that the only place they can build new high schools is south of the river and by 67 Street and 30 Avenue. 5 high schools along 30 Ave.
There is thousands of acres of land available north of 11a. There is currently no high school in Blackfalds. There will be 55,000 residents in Red Deer living north of the river, but no high school is planned. There is a plan for a high school to be built in Blackfalds in the next 2 years. The population of Blackfalds is about 9328, which saw an increase of 700 residents last year, while the city saw 777 residents leave the north side and 975 leave the city in total.
Can the school board trustees and chairpersons, past and present from both school boards explain how this occurred? Families are not going to move to areas without schools. You do not build schools as promised, then families will move out of the areas.
Schools are planned and never built, like Johnstone Park. High schools are never planned, so teenagers are forced to make long commutes during rush hour traffic, denied the flexibility in extra-curricular activities. Young families are laden with extra time and expense commitments, because of decisions made by school boards.
Will the school board, trustees, chairs, (past and present) as well as the candidates in the upcoming election this October address this issue?
Perhaps the city councillors and mayors, (past and present) as well as the those candidates in the upcoming election could address this issue?
The discrimination against the residents living north of the river has been covered over and hidden for far too long, it needs to be addressed. Would you not agree.

[This article was originally published in City Journal, a public policy magazine and website published by the Manhattan Institute for Policy Research]
By Adam Zivo
A Canadian poll finds that racial minorities don’t believe drug enforcement is bigoted.
Is drug prohibition racist? Many left-wing institutions seem to think so. But their argument is historically illiterate—and it contradicts recent polling data, too, which show that minorities overwhelmingly reject that view.
Policies and laws are tools to establish order. Like any tool, they can be abused. The first drug laws in North America, dating back to the late nineteenth and early twentieth centuries, arguably fixated on opium as a legal pretext to harass Asian immigrants, for example. But no reasonable person would argue that laws against home invasion, murder, or theft are “racist” because they have been misapplied in past cases. Absent supporting evidence, leaping from “this tool is sometimes used in racist ways” to “this tool is essentially racist” is kindergarten-level reasoning.
Yet this is precisely what institutions and activist groups throughout the Western world have done. The Drug Policy Alliance, a U.S.-based organization, suggests that drug prohibition is rooted in “racism and fear.” Harm Reduction International, a British NGO, argues for legalization on the grounds that drug prohibition entrenches “racialized hierarchies, which were established under colonial control and continue to dominate today.” In Canada, where I live, the top public health official in British Columbia, our most drug-permissive province, released a pro-legalization report last summer claiming that prohibition is “based on a history of racism, white supremacy, paternalism, colonialism, classism and human rights violations.”
These claims ignore how drug prohibition has been and remains popular in many non-European societies. Sharia law has banned the use of mind-altering substances since the seventh century. When Indigenous leaders negotiated treaties with Canadian colonists in the late 1800s, they asked for “the exclusion of fire water (whiskey)” from their communities. That same century, China’s Qing Empire banned opium amid a national addiction crisis. “Opium is a poison, undermining our good customs and morality,” the Daoguang emperor wrote in an 1810 edict.
Today, Asian and Muslim jurisdictions impose much stiffer penalties on drug offenders than do Western nations. In countries like China, Saudi Arabia, Iran, Singapore, and Thailand, addicts and traffickers are given lengthy prison sentences or executed. Meantime, in Canada and the United States, de facto decriminalization has left urban cores littered with syringes and shrouded in clouds of meth.
The anti-drug backlash building in North America appears to be spearheaded by racial minorities. When Chesa Boudin, San Francisco’s former district attorney, was recalled in 2022, support for his ouster was highest among Asian voters. Last fall, 73 percent of Latinos backed California’s Proposition 36, which heightened penalties for drug crimes, while only 58 percent of white respondents did.
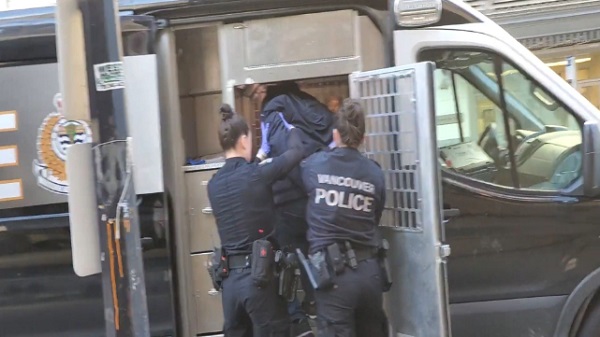
In Canada, the first signs of a parallel trend emerged during Vancouver’s 2022 municipal election, where an apparent surge in Chinese Canadian support helped install a slate of pro-police candidates. Then, in British Columbia’s provincial election last autumn, nonwhite voters strongly preferred the BC Conservatives, who campaigned on stricter drug laws. And in last month’s federal election, within both Vancouver and Toronto’s metropolitan areas, tough-on-crime conservatives received considerable support from South Asian communities.
These are all strong indicators that racial minorities do not, in fact, universally favor drug legalization. But their small population share means there is relatively little polling data to measure their preferences. Since only 7.6 percent of Americans are Asian, for example, a poll of 1,000 randomly selected people will yield an average of only 76 Asian respondents—too small a sample from which to draw meaningful conclusions. You can overcome this barrier by commissioning very large polls, but that’s expensive.
Nonetheless, last autumn, the Centre for Responsible Drug Policy (a nonprofit I founded and operate) did just that. In partnership with the Macdonald-Laurier Institute, we contracted Mainstreet Research to ask over 12,000 British Columbians: “Do you agree or disagree that criminalizing drugs is racist?”
The results undermine progressives’ assumptions. Only 26 percent of nonwhite respondents agreed (either strongly or weakly) that drug criminalization is racist, while over twice as many (56 percent) disagreed. The share of nonwhite respondents who strongly disagreed was three times larger than the share that strongly agreed (43.2 percent versus 14.3 percent). These results are fairly conclusive for this jurisdiction, given the poll’s sample size of 2,233 nonwhite respondents and a margin of error of 2 percent.
Notably, Indigenous respondents seemed to be the most anti-drug ethnic group: only 20 percent agreed (weakly or strongly) with the “criminalization is racist” narrative, while 61 percent disagreed. Once again, those who disagreed were much more vehement than those who agreed. With a sample size of 399 respondents, the margin of error here (5 percent) is too small to confound these dramatic results.
We saw similar outcomes for other minority groups, such as South Asians, Southeast Asians, Latinos, and blacks. While Middle Eastern respondents also seemed to follow this trend, the poll included too few of them to draw definitive conclusions. Only East Asians were divided on the issue, though a clear majority still disagreed that criminalization is racist.
As this poll was limited to British Columbian respondents, our findings cannot necessarily be assumed to hold throughout Canada and the United States. But since the province is arguably the most drug-permissive jurisdiction within the two countries, these results could represent the ceiling of pro-drug, anti-criminalization attitudes among minority communities.
Legalization proponents and their progressive allies take pride in being “anti-racist.” Our polling, however, suggests that they are not listening to the communities they profess to care about.
The Bureau is a reader-supported publication.
To receive new posts and support my work, consider becoming a free or paid subscriber.
Invite your friends and earn rewards
From The Center Square
By
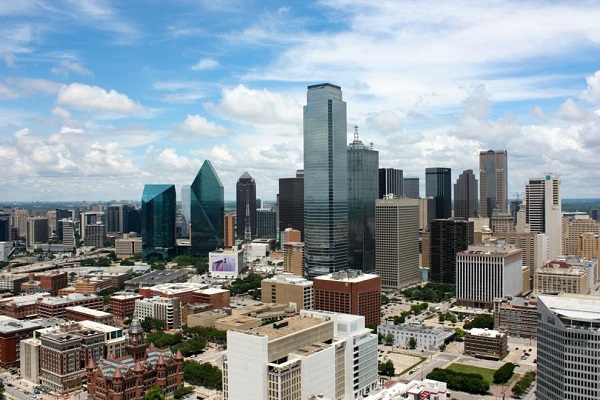
After the self-described socialist Zohran Mamdani won the Democratic primary for mayor in New York, Dallas Mayor Eric Johnson invited New Yorkers and others to move to Dallas.
Mamdani has vowed to implement a wide range of tax increases on corporations and property and to “shift the tax burden” to “richer and whiter neighborhoods.”
New York businesses and individuals have already been relocating to states like Texas, which has no corporate or personal income taxes.
Johnson, a Black mayor and former Democrat, switched parties to become a Republican in 2023 after opposing a city council tax hike, The Center Square reported.
“Dear Concerned New York City Resident or Business Owner: Don’t panic,” Johnson said. “Just move to Dallas, where we strongly support our police, value our partners in the business community, embrace free markets, shun excessive regulation, and protect the American Dream!”
Fortune 500 companies and others in recent years continue to relocate their headquarters to Dallas; it’s also home to the new Texas Stock Exchange (TXSE). The TXSE will provide an alternative to the New York Stock Exchange and Nasdaq and there are already more finance professionals in Texas than in New York, TXSE Group Inc. founder and CEO James Lee argues.
From 2020-2023, the Dallas-Fort Worth-Arlington MSA reported the greatest percentage of growth in the country of 34%, The Center Square reported.
Johnson on Thursday continued his invitation to New Yorkers and others living in “socialist” sanctuary cities, saying on social media, “If your city is (or is about to be) a sanctuary for criminals, mayhem, job-killing regulations, and failed socialist experiments, I have a modest invitation for you: MOVE TO DALLAS. You can call us the nation’s first official ‘Sanctuary City from Socialism.’”
“We value free enterprise, law and order, and our first responders. Common sense and the American Dream still reside here. We have all your big-city comforts and conveniences without the suffocating vice grip of government bureaucrats.”
As many Democratic-led cities joined a movement to defund their police departments, Johnson prioritized police funding and supporting law and order.
“Back in the 1800s, people moving to Texas for greater opportunities would etch ‘GTT’ for ‘Gone to Texas’ on their doors moving to the Mexican colony of Tejas,” Johnson continued, referring to Americans who moved to the Mexican colony of Tejas to acquire land grants from the Mexican government.
“If you’re a New Yorker heading to Dallas, maybe try ‘GTD’ to let fellow lovers of law and order know where you’ve gone,” Johnson said.
Modern-day GTT movers, including a large number of New Yorkers, cite high personal income taxes, high property taxes, high costs of living, high crime, and other factors as their reasons for leaving their states and moving to Texas, according to multiple reports over the last few years.
In response to Johnson’s invitation, Gov. Greg Abbott said, “Dallas is the first self-declared “Sanctuary City from Socialism. The State of Texas will provide whatever support is needed to fulfill that mission.”
The governor has already been doing this by signing pro-business bills into law and awarding Texas Enterprise Grants to businesses that relocate or expand operations in Texas, many of which are doing so in the Dallas area.
“Texas truly is the Best State for Business and stands as a model for the nation,” Abbott said. “Freedom is a magnet, and Texas offers entrepreneurs and hardworking Texans the freedom to succeed. When choosing where to relocate or expand their businesses, more innovative industry leaders recognize the competitive advantages found only in Texas. The nation’s leading CEOs continually cite our pro-growth economic policies – with no corporate income tax and no personal income tax – along with our young, skilled, diverse, and growing workforce, easy access to global markets, robust infrastructure, and predictable business-friendly regulations.”


New Peer-Reviewed Study Affirms COVID Vaccines Reduce Fertility
Ottawa Funded the China Ferry Deal—Then Pretended to Oppose It
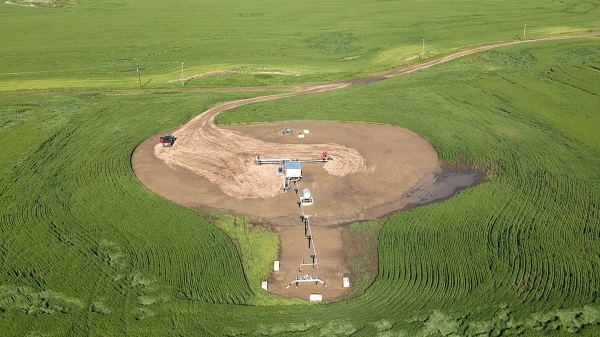
The permanent CO2 storage site at the end of the Alberta Carbon Trunk Line is just getting started

Canada’s euthanasia regime is not health care, but a death machine for the unwanted
-
 Alberta10 hours ago
Alberta Independence Seekers Take First Step: Citizen Initiative Application Approved, Notice of Initiative Petition Issued
-
 Crime9 hours ago
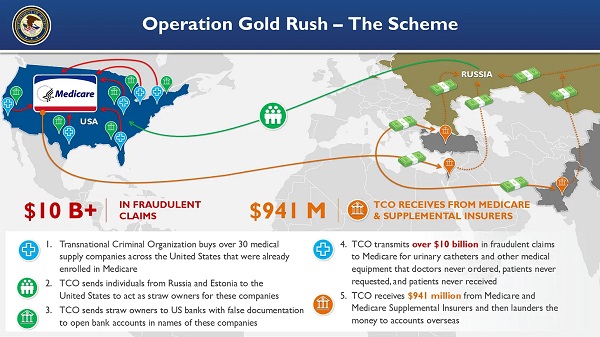
National Health Care Fraud Takedown Results in 324 Defendants Charged in Connection with Over $14.6 Billion in Alleged Fraud
-
 Health8 hours ago
RFK Jr. Unloads Disturbing Vaccine Secrets on Tucker—And Surprises Everyone on Trump
-
 Bruce Dowbiggin11 hours ago
The Game That Let Canadians Forgive The Liberals — Again
-
 Alberta1 day ago
COVID mandates protester in Canada released on bail after over 2 years in jail
-
 Crime2 days ago
Project Sleeping Giant: Inside the Chinese Mercantile Machine Linking Beijing’s Underground Banks and the Sinaloa Cartel
-
 Business1 day ago
Canada’s loyalty to globalism is bleeding our economy dry
-
 armed forces1 day ago
Canada’s Military Can’t Be Fixed With Cash Alone