Business
China, Mexico, Canada Flagged in $1.4 Billion Fentanyl Trade by U.S. Financial Watchdog


 Sam Cooper
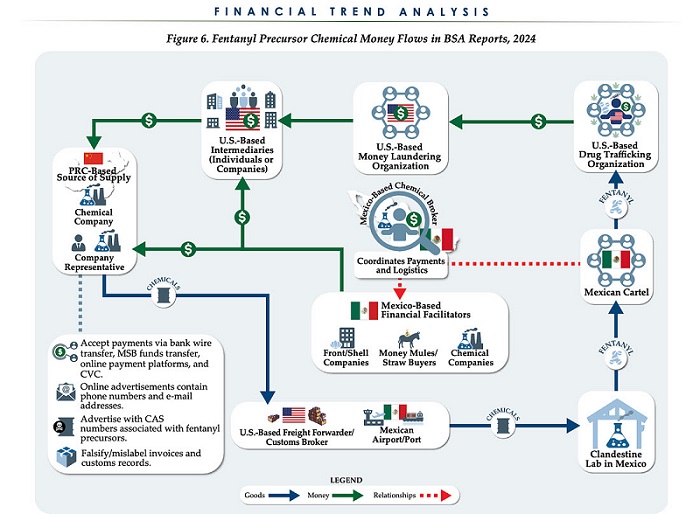
The U.S. Treasury’s Financial Crimes Enforcement Network (FinCEN) has identified $1.4 billion in fentanyl-linked suspicious transactions, naming China, Mexico, Canada, and India as key foreign touchpoints in the global production and laundering network. The analysis, based on 1,246 Bank Secrecy Act filings submitted in 2024, tracks financial activity spanning chemical purchases, trafficking logistics, and international money laundering operations.
The data reveals that Mexico and the People’s Republic of China were the two most frequently named foreign jurisdictions in financial intelligence gathered by FinCEN. Most of the flagged transactions originated in U.S. cities, the report notes, due to the “domestic nature” of Bank Secrecy Act data collection. Among foreign jurisdictions, Mexico, China, Hong Kong, and Canada were cited most often in fentanyl-related financial activity.
The FinCEN report points to Mexico as the epicenter of illicit fentanyl production, with Mexican cartels importing precursor chemicals from China and laundering proceeds through complex financial routes involving U.S., Canadian, and Hong Kong-based actors.
The findings also align with testimony from U.S. and Canadian law enforcement veterans who have told The Bureau that Chinese state-linked actors sit atop a decentralized but industrialized global fentanyl economy—supplying precursors, pill presses, and financing tools that rely on trade-based money laundering and professional money brokers operating across North America.
“Filers also identified PRC-based subjects in reported money laundering activity, including suspected trade-based money laundering schemes that leveraged the Chinese export sector,” the report says.
A point emphasized by Canadian and U.S. experts—including former U.S. State Department investigator Dr. David Asher—that professional Chinese money laundering networks operating in North America are significantly commanded by Chinese Communist Party–linked Triad bosses based in Ontario and British Columbia—is not explored in detail in this particular FinCEN report.¹
Chinese chemical manufacturers—primarily based in Guangdong, Zhejiang, and Hebei provinces—were repeatedly cited for selling fentanyl precursors via wire transfers and money service businesses. These sales were often facilitated through e-commerce platforms, suggesting that China’s global retail footprint conceals a lethal underground market—one that ultimately fuels a North American public health crisis. In many cases, the logistics were sophisticated: some Chinese companies even offered delivery guarantees and customs clearance for precursor shipments, raising red flags for enforcement officials.
While China’s industrial base dominates the global fentanyl supply chain, Mexican cartels are the next most prominent state-like actors in the ecosystem—but the report emphasizes that Canada and India are rising contributors.
“Subjects in other foreign countries—including Canada, the Dominican Republic, and India—highlight the presence of alternative suppliers of precursor chemicals and fentanyl,” the report says.
“Canada-based subjects were primarily identified by Bank Secrecy Act filers due to their suspected involvement in drug trafficking organizations allegedly sourcing fentanyl and other drugs from traditional drug source countries, such as Mexico,” it explains, adding that banking intelligence “identified activity indicative of Canada-based individuals and companies purchasing precursor chemicals and laboratory equipment that may be related to the synthesis of fentanyl in Canada. Canada-based subjects were primarily reported with addresses in the provinces of British Columbia and Ontario.”
FinCEN also flagged activity from Hong Kong-based shell companies—often subsidiaries or intermediaries for Chinese chemical exporters. These entities were used to obscure the PRC’s role in transactions and to move funds through U.S.-linked bank corridors.

Breaking down the fascinating and deadly world of Chinese underground banking used to move fentanyl profits from American cities back to producers, the report explains how Chinese nationals in North America are quietly enlisted to move large volumes of cash across borders—without ever triggering traditional wire transfers.
These networks, formally known as Chinese Money Laundering Organizations (CMLOs), operate within a global underground banking system that uses “mirror transfers.” In this system, a Chinese citizen with renminbi in China pays a local broker, while the U.S. dollar equivalent is handed over—often in cash—to a recipient in cities like Los Angeles or New York who may have no connection to the original Chinese depositor aside from their role in the laundering network. The renminbi, meanwhile, is used inside China to purchase goods such as electronics, which are then exported to Mexico and delivered to cartel-linked recipients.
FinCEN reports that US-based money couriers—often Chinese visa holders—were observed depositing large amounts of cash into bank accounts linked to everyday storefront businesses, including nail salons and restaurants. Some of the cash was then used to purchase cashier’s checks, a common method used to obscure the origin and destination of the funds. To banks, the activity might initially appear consistent with a legitimate business. However, modern AI-powered transaction monitoring systems are increasingly capable of flagging unusual patterns—such as small businesses conducting large or repetitive transfers that appear disproportionate to their stated operations.
On the Mexican side, nearly one-third of reports named subjects located in Sinaloa and Jalisco, regions long controlled by the Sinaloa Cartel and Cartel Jalisco Nueva Generación. Individuals in these states were often cited as recipients of wire transfers from U.S.-based senders suspected of repatriating drug proceeds. Others were flagged as originators of payments to Chinese chemical suppliers, raising alarms about front companies and brokers operating under false pretenses.
The report outlines multiple cases where Mexican chemical brokers used generic payment descriptions such as “goods” or “services” to mask wire transfers to China. Some of these transactions passed through U.S.-based intermediaries, including firms owned by Chinese nationals. These shell companies were often registered in unrelated sectors—like marketing, construction, or hardware—and exhibited red flags such as long dormancy followed by sudden spikes in large transactions.
Within the United States, California, Florida, and New York were most commonly identified in fentanyl-related financial filings. These locations serve as key hubs for distribution and as collection points for laundering proceeds. Cash deposits and peer-to-peer payment platforms were the most cited methods for fentanyl-linked transactions, appearing in 54 percent and 51 percent of filings, respectively.
A significant number of flagged transactions included slang terms and emojis—such as “blues,” “ills,” or blue dots—in memo fields. Structured cash deposits were commonly made across multiple branches or ATMs, often linked to otherwise legitimate businesses such as restaurants, salons, and trucking firms.
FinCEN also tracked a growing number of trade-based laundering schemes, in which proceeds from fentanyl sales were used to buy electronics and vaping devices. In one case, U.S.-based companies owned by Chinese nationals made outbound payments to Chinese manufacturers, using funds pooled from retail accounts and shell companies. These goods were then shipped to Mexico, closing the laundering loop.
Another key laundering method involved cryptocurrency. Nearly 10 percent of all fentanyl-related reports involved virtual currency, with Bitcoin the most commonly cited, followed by Ethereum and Litecoin. FinCEN flagged twenty darknet marketplaces as suspected hubs for fentanyl distribution and cited failures by some digital asset platforms to catch red-flag activity.
Overall, FinCEN warns that fentanyl-linked funds continue to enter the U.S. financial system through loosely regulated or poorly monitored channels, even as law enforcement ramps up enforcement. The Drug Enforcement Administration reported seizures of over 55 million counterfeit fentanyl pills in 2024 alone.
The broader pattern is unmistakable: precursor chemicals flow from China, manufacturing occurs in Mexico, Canada plays an increasing role in chemical acquisition and potential synthesis, and drugs and proceeds flood into the United States, supported by global financial tools and trade structures. The same infrastructure that enables lawful commerce is being manipulated to sustain the deadliest synthetic drug crisis in modern history.
The Bureau is a reader-supported publication.
To receive new posts and support my work, consider becoming a free or paid subscriber.
Invite your friends and earn rewards

From the Fraser Institute
By Jason Clemens and Jake Fuss
There are ostensibly two approaches to economic growth from a government policy perspective. The first is to create the best environment possible for entrepreneurs, business owners and investors by ensuring effective government that only does what’s needed, maintains competitive taxes and reasonable regulations. It doesn’t try to pick winners and losers but rather introduces policies to create a positive environment for all businesses to succeed.
The alternative is for the government to take an active role in picking winners and losers through taxes, spending and regulations. The idea here is that a government can promote certain companies and industries (as part of a larger “industrial policy”) better than allowing the market—that is, individual entrepreneurs, businesses and investors—to make those decisions.
It’s never purely one or the other but governments tend to generally favour one approach. The Trudeau era represented a marked break from the consensus that existed for more than two decades prior. Trudeau’s Ottawa introduced a series of tax measures, spending initiatives and regulations to actively constrain the traditional energy sector while promoting what the government termed the “green” economy.
The scope and cost of the policies introduced to actively pick winners and losers is hard to imagine given its breadth. Direct spending on the “green” economy by the federal government increased from $600 million the year before Trudeau took office (2014/15) to $23.0 billion last year (2024/25).
Ottawa introduced regulations to make it harder to build traditional energy projects (Bill C-69), banned tankers carrying Canadian oil from the northwest coast of British Columbia (Bill C-48), proposed an emissions cap on the oil and gas sector, cancelled pipeline developments, mandated almost all new vehicles sold in Canada to be zero-emission by 2035, imposed new homebuilding regulations for energy efficiency, changed fuel standards, and the list goes on and on.
Despite the mountain of federal spending and regulations, which were augmented by additional spending and regulations by various provincial governments, the Canadian economy has not been transformed over the last decade, but we have suffered marked economic costs.
Consider the share of the total economy in 2014 linked with the “green” sector, a term used by Statistics Canada in its measurement of economic output, was 3.1 per cent. In 2023, the green economy represented 3.6 per cent of the Canadian economy, not even a full one-percentage point increase despite the spending and regulating.
And Ottawa’s initiatives did not deliver the green jobs promised. From 2014 to 2023, only 68,000 jobs were created in the entire green sector, and the sector now represents less than 2 per cent of total employment.
Canada’s economic performance cratered in line with this new approach to economic growth. Simply put, rather than delivering the promised prosperity, it delivered economic stagnation. Consider that Canadian living standards, as measured by per-person GDP, were lower as of the second quarter of 2025 compared to six years ago. In other words, we’re poorer today than we were six years ago. In contrast, U.S. per-person GDP grew by 11.0 per cent during the same period.
Median wages (midpoint where half of individuals earn more, and half earn less) in every Canadian province are now lower than comparable median wages in every U.S. state. Read that again—our richest provinces now have lower median wages than the poorest U.S. states.
A significant part of the explanation for Canada’s poor performance is the collapse of private business investment. Simply put, businesses didn’t invest much in Canada, particularly when compared to the United States, and this was all pre-Trump tariffs. Canada’s fundamentals and the general business environment were simply not conducive to private-sector investment.
These results stand in stark contrast to the prosperity enjoyed by Canadians during the Chrétien to Harper years when the focus wasn’t on Ottawa picking winners and losers but rather trying to establish the most competitive environment possible to attract and retain entrepreneurs, businesses, investors and high-skilled professionals. The policies that dominated this period are the antithesis of those in place now: balanced budgets, smaller but more effective government spending, lower and competitive taxes, and smart regulations.
As the Carney government prepares to present its first budget to the Canadian people, many questions remain about whether there will be a genuine break from the policies of the Trudeau government or whether it will simply be the same old same old but dressed up in new language and fancy terms. History clearly tells us that when governments try to pick winners and losers, the strategy doesn’t lead to prosperity but rather stagnation. Let’s all hope our new prime minister knows his history and has learned its lessons.

Jason Clemens
Executive Vice President, Fraser Institute

Jake Fuss
Director, Fiscal Studies, Fraser Institute

From the Fraser Institute
By Jake Fuss, Tegan Hill and William Dunstan
Next week, the Carney government will table its long-awaited first budget. Earlier this year, Prime Minister Mark Carney launched a federal spending review to find $25 billion in savings by 2028. Even if the government meets this goal, it won’t be enough to eliminate the federal deficit—projected to reach as high as $92.2 billion in 2025/26—and start paying down debt. That means a substantial amount of taxpayer dollars will continue to flow towards federal debt interest payments, rather than programs and services or tax relief for Canadians.
When a government spends more than it raises in revenue and runs a budget deficit, it accumulates debt. As of 2024/25, the federal and provincial governments will have accumulated a total projected $2.3 trillion in combined net debt (total debt minus financial assets).
Of course, like households, governments must pay interest on their debt. According to our recent study, the provinces and federal government expect to spend a combined $92.5 billion on debt interest payments in 2024/25.
And like any government spending, taxpayers fund these debt interest payments. The difference is that instead of funding important programs, such as health care, these taxpayer dollars will finance government debt. This is the cost of deficit spending.
How much do Canadians pay each year in government debt interest costs? On a per-person basis, combined provincial and federal debt interest costs in 2024/25 are expected to range from $1,937 in Alberta to $3,432 in Newfoundland and Labrador. These figures represent provincial debt interest costs, plus the federal portion allocated to each province based on a five-year average (2020-2024) of their share of Canada’s population.
For perspective, it’s helpful to compare debt interest payments to other budget items. For instance, the federal government estimates that in 2024/25 it will spend more on debt interest costs ($53.8 billion) than on child-care benefits ($35.1 billion) or the Canada Health Transfer ($52.1 billion), which supports provincial health-care systems.
Provincial governments too spend more money on interest payments than on large programs. For example, in 2024/25, Ontario expects to spend more on debt interest payments ($15.2 billion) than on post-secondary education ($14.2 billion). That same year, British Columbia expects to spend more on debt interest payments ($4.4 billion) than on child welfare ($4.3 billion).
Unlike other forms of spending, governments cannot simply decide to spend less on debt interest payments in a given year. To lower their debt interest payments, governments must rein in spending and eliminate deficits so they can start to pay down debt.
Unfortunately, most governments in Canada are doing the opposite. All but one province (Saskatchewan) plans to run a deficit in 2025/26 while the federal deficit could exceed $90 billion.
To stop racking up debt, governments must balance their budgets. By spending less today, governments can ensure that a larger share of tax dollars go towards programs or tax relief to benefit Canadians rather than simply financing government debt.
Jake Fuss
Director, Fiscal Studies, Fraser Institute

Tegan Hill

William Dunstan


From Underdog to Top Broodmare
Trans Mountain executive says it’s time to fix the system, expand access, and think like a nation builder

The painful return of food inflation exposes Canada’s trade failures
Premier Smith sending teachers back to school and setting up classroom complexity task force
-
Alberta6 hours ago
From Underdog to Top Broodmare
-
National2 days ago
Canadian MPs order ethics investigation into Mark Carney’s corporate interests
-
 National2 days ago
Canada’s NDP is now calling women ‘non-males’
-
 Alberta2 days ago
Nobel Prize nods to Alberta innovation in carbon capture
-
 Business1 day ago
Canada’s attack on religious charities makes no fiscal sense
-
 International17 hours ago
Prince Andrew banished from the British monarchy
-
 Business17 hours ago
“We have a deal”: Trump, Xi strike breakthrough on trade and fentanyl
-
 MxM News2 days ago
Trump ‘Grateful’ For Bill Gates Pivot, Declares Victory Over ‘Climate Change Hoax’