Canadian Energy Centre
Business leaders blast Ottawa’s ‘unnecessary and unacceptable’ oil and gas emissions cap


From the Canadian Energy Centre
The federal government is proceeding with its plans to cap emissions from the oil and gas industry in a move business leaders say will ultimately hurt Indigenous communities and everyday Canadians.
The Business Council of Canada called the cap part of a “full-on charge against the oil and gas sector.”
The government announced on December 7 that it will implement measures to cap oil and gas emissions in 2030 at 35 to 38 percent below 2019 levels. A similar cap has not been announced for any other industry.
“It all seems punitive and short-sighted,” wrote Business Council of Canada vice-president Michael Gullo and Theo Argitis, managing director of Compass Rose Group.
A cap on production
They don’t put much stock into the government’s claims that the cap is not intended to limit Canada’s oil and gas production.
“That’s semantics. To work, a cap would ultimately need to be severe enough to curtail production if needed, and that would have significant economic consequences,” Gullo and Argitis said, warning of a “direct and immediate” loss of income for Canada’s economy.
“There would be significant indirect costs as well, incurred by every household and business across the nation because Canada relies on income generated by oil and gas companies—totaling $270 billion in 2022 alone—to support social programs like health care, education, and infrastructure,” they wrote.
Already on the path to net zero
On the world’s current trajectory, oil and gas will still account for 46 per cent of world energy needs in 2050, down only moderately from 51 per cent in 2022, according to the International Energy Agency.
Industry leaders argue that Canada’s oil and gas producers are already on the path to net zero emissions without the need for the cap.
According to Environment and Climate Change Canada’s latest report to the United Nations, emissions from so-called “conventional” (non-oil sands) production declined to 26 megatonnes in 2021, from 34 megatonnes in 2019.
Producers in Alberta have already reduced total methane emissions by 45 per cent compared to 2014, hitting the target three years ahead of schedule.
Oil sands emissions did not increase last year despite production growth, and total emissions are expected to start going down before 2025, according to S&P Global.
“Imposing an emissions cap on Canada’s oil and gas producers, who are already achieving significant emissions reductions as shown in the federal government’s own data, is unnecessary and unacceptable,” the Explorers and Producers Association of Canada said in a statement.
A cap on Indigenous opportunity
The Indigenous Resource Network (IRN) – which advocates for Indigenous participation in resource projects – said the cap would be “devastating” for Indigenous communities.
“A pathway to self-determination is being achieved through the ownership of oil and gas projects and involvement in the sector,” said IRN executive director John Desjarlais.
“This would result in a cap on Indigenous opportunity in the oil and gas sector.”
Desjarlais said the IRN is seeking an exemption from the cap for Indigenous communities who are engaged in oil and gas development.
He said the proposed cap directly contradicts the government’s promises on reconciliation and its support for the United Nations Declaration on the Rights of Indigenous People.
Counter–approach to the United States
The approach of capping emissions runs counter to the incentive-based approach being pursued in the United States, the Canadian Association of Energy Contractors (CAOEC) said in a statement.
“There, the Inflation Reduction Act has attracted capital and accelerated low-carbon technology and innovation in the energy sector at the expense of Canadian businesses and workers,” the CAOEC said.
Ottawa has yet to finalize announced investment tax credits to support clean technologies like hydrogen production and carbon capture, utilization and storage (CCUS), the Business Council of Canada noted.
“We have engaged the federal government in good faith over the past two years and have asked them to partner with us to accelerate the deployment of carbon abatement technology. As of today, we have received no support from this government,” said CAOEC president Mark Scholz.
“Stop working against us and start working with us.”
Final regulations on the proposed emissions cap are expected in 2025.
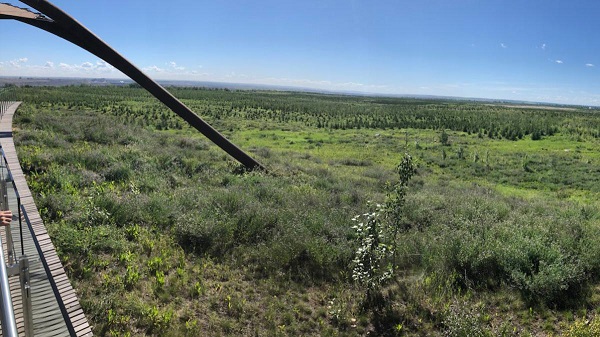
Wapisiw Lookout, reclaimed site of the oil sands industry’s first tailings pond, which started in 1967. The area was restored to a solid surface in 2010 and now functions as a 220-acre watershed. Photo courtesy Suncor Energy
From the Canadian Energy Centre
By CEC Research
Mines demonstrate significant strides through technological innovation
Tailings are a byproduct of mining operations around the world.
In Alberta’s oil sands, tailings are a fluid mixture of water, sand, silt, clay and residual bitumen generated during the extraction process.
Engineered basins or “tailings ponds” store the material and help oil sands mining projects recycle water, reducing the amount withdrawn from the Athabasca River.
In 2023, 79 per cent of the water used for oil sands mining was recycled, according to the latest data from the Alberta Energy Regulator (AER).
Decades of operations, rising production and federal regulations prohibiting the release of process-affected water have contributed to a significant accumulation of oil sands fluid tailings.
The Mining Association of Canada describes that:
“Like many other industrial processes, the oil sands mining process requires water.
However, while many other types of mines in Canada like copper, nickel, gold, iron ore and diamond mines are allowed to release water (effluent) to an aquatic environment provided that it meets stringent regulatory requirements, there are no such regulations for oil sands mines.
Instead, these mines have had to retain most of the water used in their processes, and significant amounts of accumulated precipitation, since the mines began operating.”
Despite this ongoing challenge, oil sands mining operators have made significant strides in reducing fluid tailings through technological innovation.
This is demonstrated by reductions in “legacy fluid tailings” since 2015.
Legacy Fluid Tailings vs. New Fluid Tailings
As part of implementing the Tailings Management Framework introduced in March 2015, the AER released Directive 085: Fluid Tailings Management for Oil Sands Mining Projects in July 2016.
Directive 085 introduced new criteria for the measurement and closure of “legacy fluid tailings” separate from those applied to “new fluid tailings.”
Legacy fluid tailings are defined as those deposited in storage before January 1, 2015, while new fluid tailings are those deposited in storage after January 1, 2015.
The new rules specified that new fluid tailings must be ready to reclaim ten years after the end of a mine’s life, while legacy fluid tailings must be ready to reclaim by the end of a mine’s life.
Total Oil Sands Legacy Fluid Tailings

Alberta’s oil sands mining sector decreased total legacy fluid tailings by approximately 40 per cent between 2015 and 2024, according to the latest company reporting to the AER.
Total legacy fluid tailings in 2024 were approximately 623 million cubic metres, down from about one billion cubic metres in 2015.
The reductions are led by the sector’s longest-running projects: Suncor Energy’s Base Mine (opened in 1967), Syncrude’s Mildred Lake Mine (opened in 1978), and Syncrude’s Aurora North Mine (opened in 2001). All are now operated by Suncor Energy.
The Horizon Mine, operated by Canadian Natural Resources (opened in 2009) also reports a significant reduction in legacy fluid tailings.
The Muskeg River Mine (opened in 2002) and Jackpine Mine (opened in 2010) had modest changes in legacy fluid tailings over the period. Both are now operated by Canadian Natural Resources.
Imperial Oil’s Kearl Mine (opened in 2013) and Suncor Energy’s Fort Hills Mine (opened in 2018) have no reported legacy fluid tailings.
Suncor Energy Base Mine

Between 2015 and 2024, Suncor Energy’s Base Mine reduced legacy fluid tailings by approximately 98 per cent, from 293 million cubic metres to 6 million cubic metres.
Syncrude Mildred Lake Mine

Between 2015 and 2024, Syncrude’s Mildred Lake Mine reduced legacy fluid tailings by approximately 15 per cent, from 457 million cubic metres to 389 million cubic metres.
Syncrude Aurora North Mine

Between 2015 and 2024, Syncrude’s Aurora North Mine reduced legacy fluid tailings by approximately 25 per cent, from 102 million cubic metres to 77 million cubic metres.
Canadian Natural Resources Horizon Mine

Between 2015 and 2024, Canadian Natural Resources’ Horizon Mine reduced legacy fluid tailings by approximately 36 per cent, from 66 million cubic metres to 42 million cubic metres.
Total Oil Sands Fluid Tailings
Reducing legacy fluid tailings has helped slow the overall growth of fluid tailings across the oil sands sector.
Without efforts to reduce legacy fluid tailings, the total oil sands fluid tailings footprint today would be approximately 1.6 billion cubic metres.
The current fluid tailings volume stands at approximately 1.2 billion cubic metres, up from roughly 1.1 billion in 2015.

The unaltered reproduction of this content is free of charge with attribution to the Canadian Energy Centre.
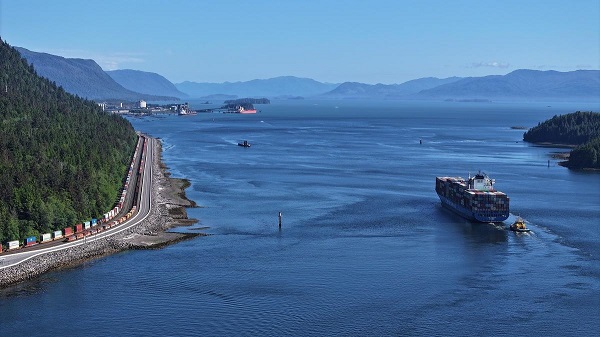
The Port of Prince Rupert on the north coast of British Columbia. Photo courtesy Prince Rupert Port Authority
From the Canadian Energy Centre
By Will Gibson
Moratorium does little to improve marine safety while sending the wrong message to energy investors
In 2019, Martha Hall Findlay, then-CEO of the Canada West Foundation, penned a strongly worded op-ed in the Globe and Mail calling the federal ban of oil tankers on B.C.’s northern coast “un-Canadian.”
Six years later, her opinion hasn’t changed.
“It was bad legislation and the government should get rid of it,” said Hall Findlay, now director of the University of Calgary’s School of Public Policy.
The moratorium, known as Bill C-48, banned vessels carrying more than 12,500 tonnes of oil from accessing northern B.C. ports.
Targeting products from one sector in one area does little to achieve the goal of overall improved marine transport safety, she said.
“There are risks associated with any kind of transportation with any goods, and not all of them are with oil tankers. All that singling out one part of one coast did was prevent more oil and gas from being produced that could be shipped off that coast,” she said.
Hall Findlay is a former Liberal MP who served as Suncor Energy’s chief sustainability officer before taking on her role at the University of Calgary.
She sees an opportunity to remove the tanker moratorium in light of changing attitudes about resource development across Canada and a new federal government that has publicly committed to delivering nation-building energy projects.
“There’s a greater recognition in large portions of the public across the country, not just Alberta and Saskatchewan, that Canada is too dependent on the United States as the only customer for our energy products,” she said.
“There are better alternatives to C-48, such as setting aside what are called Particularly Sensitive Sea Areas, which have been established in areas such as the Great Barrier Reef and the Galapagos Islands.”
The Business Council of British Columbia, which represents more than 200 companies, post-secondary institutions and industry associations, echoes Hall Findlay’s call for the tanker ban to be repealed.
“Comparable shipments face no such restrictions on the East Coast,” said Denise Mullen, the council’s director of environment, sustainability and Indigenous relations.
“This unfair treatment reinforces Canada’s over-reliance on the U.S. market, where Canadian oil is sold at a discount, by restricting access to Asia-Pacific markets.
“This results in billions in lost government revenues and reduced private investment at a time when our economy can least afford it.”
The ban on tanker traffic specifically in northern B.C. doesn’t make sense given Canada already has strong marine safety regulations in place, Mullen said.
Notably, completion of the Trans Mountain Pipeline expansion in 2024 also doubled marine spill response capacity on Canada’s West Coast. A $170 million investment added new equipment, personnel and response bases in the Salish Sea.
“The [C-48] moratorium adds little real protection while sending a damaging message to global investors,” she said.
“This undermines the confidence needed for long-term investment in critical trade-enabling infrastructure.”
Indigenous Resource Network executive director John Desjarlais senses there’s an openness to revisiting the issue for Indigenous communities.
“Sentiment has changed and evolved in the past six years,” he said.
“There are still concerns and trust that needs to be built. But there’s also a recognition that in addition to environmental impacts, [there are] consequences of not doing it in terms of an economic impact as well as the cascading socio-economic impacts.”
The ban effectively killed the proposed $16-billion Eagle Spirit project, an Indigenous-led pipeline that would have shipped oil from northern Alberta to a tidewater export terminal at Prince Rupert, B.C.
“When you have Indigenous participants who want to advance these projects, the moratorium needs to be revisited,” Desjarlais said.
He notes that in the six years since the tanker ban went into effect, there are growing partnerships between B.C. First Nations and the energy industry, including the Haisla Nation’s Cedar LNG project and the Nisga’a Nation’s Ksi Lisims LNG project.
This has deepened the trust that projects can mitigate risks while providing economic reconciliation and benefits to communities, Dejarlais said.
“Industry has come leaps and bounds in terms of working with First Nations,” he said.
“They are treating the rights of the communities they work with appropriately in terms of project risk and returns.”
Hall Findlay is cautiously optimistic that the tanker ban will be replaced by more appropriate legislation.
“I’m hoping that we see the revival of a federal government that brings pragmatism to governing the country,” she said.
“Repealing C-48 would be a sign of that happening.”


Ottawa Funded the China Ferry Deal—Then Pretended to Oppose It

New Peer-Reviewed Study Affirms COVID Vaccines Reduce Fertility
The permanent CO2 storage site at the end of the Alberta Carbon Trunk Line is just getting started

Canada’s euthanasia regime is not health care, but a death machine for the unwanted
-
 Alberta7 hours ago
Alberta Independence Seekers Take First Step: Citizen Initiative Application Approved, Notice of Initiative Petition Issued
-
 Crime6 hours ago
National Health Care Fraud Takedown Results in 324 Defendants Charged in Connection with Over $14.6 Billion in Alleged Fraud
-
 Health5 hours ago
RFK Jr. Unloads Disturbing Vaccine Secrets on Tucker—And Surprises Everyone on Trump
-
 Bruce Dowbiggin8 hours ago
The Game That Let Canadians Forgive The Liberals — Again
-
 Alberta1 day ago
COVID mandates protester in Canada released on bail after over 2 years in jail
-
 Crime2 days ago
Project Sleeping Giant: Inside the Chinese Mercantile Machine Linking Beijing’s Underground Banks and the Sinaloa Cartel
-
 Alberta2 days ago
Alberta uncorks new rules for liquor and cannabis
-
 armed forces1 day ago
Canada’s Military Can’t Be Fixed With Cash Alone