Canadian Energy Centre
North America LNG project cost competitiveness
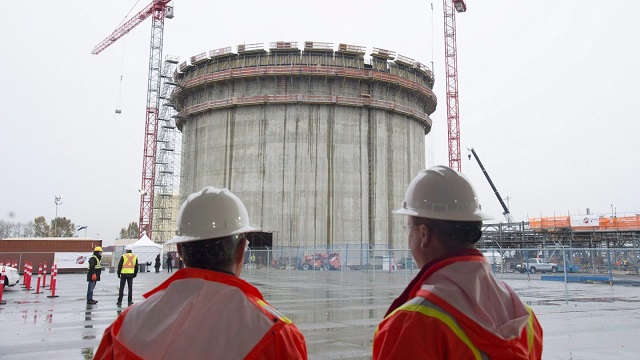

Construction workers look on at the FortisBC Tilbury LNG expansion project in Delta, B.C., Monday, Nov. 16, 2015. CP Images photo
From the Canadian Energy Centre
Lower costs for natural gas, shipping and liquefaction give Canada an edge in the emerging global LNG market
Worldwide concerns about energy security have put a renewed focus on the international liquefied natural gas (LNG) industry. The global demand for LNG is expected to increase over the next few decades.
Global demand growth will be driven primarily by Asian markets where the need for LNG is expected to increase from 277 million tonnes (MT) in 2025 to 509 MT by 2050 (see Figure 1). By 2050 the demand for LNG in Europe will be 83 MT and in Africa 20 MT. In South America too, demand will increase – from 13 MT in 2025 to 31 MT in 2050.

Source: Derived from Rystad Energy, Gas and LNG Markets Solution.
In North America (Canada, Mexico, and United States) a number of LNG projects that are either under construction or in the planning stages will benefit from the rise in global LNG demand.
North American LNG production is expected to grow from 112 MT in 2025 to over 255 MT by 2050 (see Figure 2). In Canada, the LNG projects under construction or in the planning stages include LNG Canada Phases 1 & 2, Woodfibre LNG, Cedar LNG, the Tilbury LNG expansion, and Ksi Lisims LNG. Canada’s LNG production is expected to grow from just 2 MT in 2025 to over 43 MT by 2050. In the United States production is projected to increase from 108 MT in 2025 to 210 MT in 2050.

Source: Derived from Rystad Energy, Gas and LNG Markets Solution.
This CEC Fact Sheet uses Rystad Energy’s Gas and LNG Markets Solution¹ to benchmark the cost competitiveness of LNG projects that are under construction and proposed in Canada compared to other LNG projects under construction and planned elsewhere in North America. (Note that the content of this report does not represent the views of Rystad Energy.)
The LNG cost competitiveness benchmarking analysis used the following performance metrics:
- LNG plant free-on-board (FOB) cost break-even;
- Total LNG plant cost (for delivery into Asia and Europe).
The objective of this LNG cost competitiveness benchmarking is to compare the competitiveness of Canadian LNG projects against those of major competitors in the United States and Mexico. The selection of other North American LNG facilities for the benchmark comparison with Canadian LNG projects (LNG Canada, the Tilbury LNG Expansion, Woodfibre LNG, Cedar LNG, and Ksi Lisims LNG) is based on the rationale that virtually all Canadian LNG plants are under construction or in the planning stage and that they compare well with other North American LNG plants that are also under construction or are being planned between 2023 and 2050. Further, to assess the cost competitiveness of the various LNG projects more accurately, we chose only North American LNG facilities with sufficient economic data to enable such a comparison. We compared the cost competitiveness of LNG coming from these other North American projects with LNG coming from Canada that is intended to be delivered to markets in Asia and Europe.
1. Rystad Energy is an independent energy research company providing data, analytics, and consultancy services to clients around the globe. Its Gas and LNG Markets Solution provides an overview of LNG markets worldwide. The Solution covers the entire value chain associated with gas and LNG production, country and sector-level demand, and LNG trade flows, infrastructure, economics, costs, and contracts through 2050. It allows for the evaluation of the entire LNG market infrastructure, including future planned projects, as well as the benchmarking of costs for LNG projects (Rystad Energy, 2024).
Comparison of LNG project FOB cost break-even (full cycle)
Figure 3 provides a comparison of the free-on-board (FOB) cost break-even for LNG facilities under construction or being planned in North America. FOB break-even costs include upstream and midstream costs for LNG excluding transportation costs (shipping) as seen from the current year. Break-even prices assume a discount rate of 10 percent and represent the point at which the net present value for an LNG project over a 20- to 30-year period becomes positive, including the payment of capital and operating costs, inclusive of taxes.
Among the selected group of North American LNG projects are Canadian LNG projects with an FOB break-even at the lower end of the range (US$7.18 per thousand cubic feet (kcf)) to those at the higher end (US$8.64 per thousand cubic feet (kcf)).
LNG projects in the United States tend to settle in the middle of the pack, with FOB break-even between US$6.44 per kcf and US$8.37 per kcf.

Mexico LNG projects have the widest variation in costs among the selected group of projects, ranging from US$6.94 per kcf to US$9.44 per kcf (see Figure 3).

Source: Derived from Rystad Energy, Gas and LNG Markets Solution.
Total costs by project for LNG delivery to Asia and Europe
The total cost by LNG plant includes FOB cost break-even, transportation costs, and the regasification tariff. Figure 4 compares total project costs for LNG destined for Asia from selected North American LNG facilities.
Canadian LNG projects are very cost competitive, and those with Asia as their intended market tend to cluster at the lower end of the scale. The costs vary by project, but range between US$8.10 per kcf and US$9.56 per kcf, making Canadian LNG projects among the lowest cost projects in North America.
The costs for Mexico’s LNG projects with Asia as the intended destination for their product tend to cluster in the middle of the pack. Costs among U.S. LNG facilities that plan to send their product to Asia tend to sit at the higher end of the scale, at between US$8.90 and US$10.80 per kcf.

Source: Derived from Rystad Energy, Gas and LNG Markets Solution.
Figure 5 compares total project costs for LNG to be delivered to Europe from select North American LNG facilities.
Costs from U.S. LNG facilities show the widest variation for this market at between US$7.48 per kcf and US$9.42 per kcf, but the majority of U.S. LNG facilities tend to cluster at the lower end of the cost scale, between US$7.48 per kcf and US$8.61 per kcf (see Figure 5).
Canadian projects that intend to deliver LNG to Europe show a variety of costs that tend to cluster at the middle to higher end of the spectrum, ranging from US$9.60 per kcf to and US$11.06 per kcf.
The costs of Mexico’s projects that are aimed at delivering LNG to Europe tend to cluster in the middle of the spectrum (US$9.11 per kcf to US$10.61 per kcf).

Source: Derived from Rystad Energy, Gas and LNG Markets Solution.
Conclusion
LNG markets are complex. Each project is unique and presents its own challenges. The future of Canadian LNG projects depends upon the overall demand and supply in the global LNG market. As the demand for LNG increases in the next decades, the world will be searching for energy security.
The lower liquefaction and shipping costs coupled with the lower cost of the natural gas itself in Western Canada translate into lower prices for Canadian LNG, particularly that destined for Asian markets. Those advantages will help make Canadian LNG very competitive and attractive to markets worldwide.
From the Canadian Energy Centre
Multilateral designs lift more energy with a smaller environmental footprint
A “weird and wonderful” drilling innovation in Alberta is helping producers tap more oil and gas at lower cost and with less environmental impact.
With names like fishbone, fan, comb-over and stingray, “multilateral” wells turn a single wellbore from the surface into multiple horizontal legs underground.
“They do look spectacular, and they are making quite a bit of money for small companies, so there’s a lot of interest from investors,” said Calin Dragoie, vice-president of geoscience with Calgary-based Chinook Consulting Services.
Dragoie, who has extensively studied the use of multilateral wells, said the technology takes horizontal drilling — which itself revolutionized oil and gas production — to the next level.
“It’s something that was not invented in Canada, but was perfected here. And it’s something that I think in the next few years will be exported as a technology to other parts of the world,” he said.
Dragoie’s research found that in 2015 less than 10 per cent of metres drilled in Western Canada came from multilateral wells. By last year, that share had climbed to nearly 60 per cent.
Royalty incentives in Alberta have accelerated the trend, and Saskatchewan has introduced similar policy.
Multilaterals first emerged alongside horizontal drilling in the late 1990s and early 2000s, Dragoie said. But today’s multilaterals are longer, more complex and more productive.
The main play is in Alberta’s Marten Hills region, where producers are using multilaterals to produce shallow heavy oil.
Today’s average multilateral has about 7.5 horizontal legs from a single surface location, up from four or six just a few years ago, Dragoie said.
One record-setting well in Alberta drilled by Tamarack Valley Energy in 2023 features 11 legs stretching two miles each, for a total subsurface reach of 33 kilometres — the longest well in Canada.
By accessing large volumes of oil and gas from a single surface pad, multilaterals reduce land impact by a factor of five to ten compared to conventional wells, he said.
The designs save money by skipping casing strings and cement in each leg, and production is amplified as a result of increased reservoir contact.
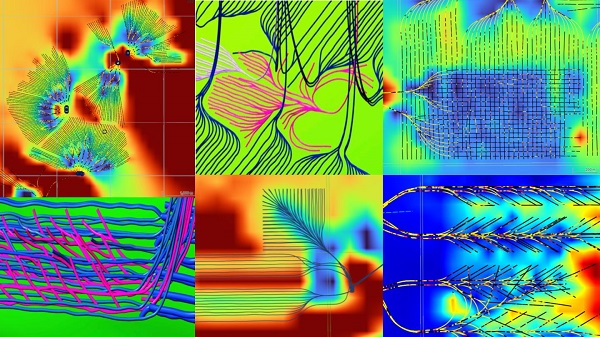
Here are examples of multilateral well design. Images courtesy Chinook Consulting Services.
Parallel

Fishbone

Fan

Waffle

Stingray

Frankenwells


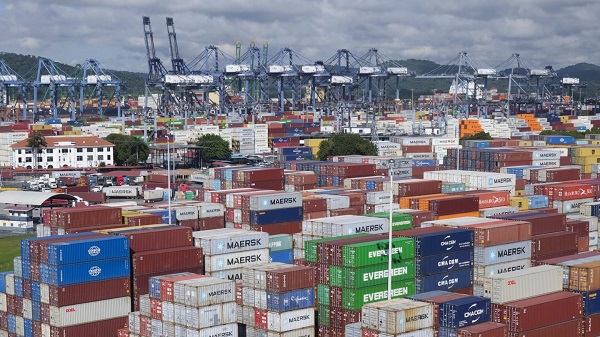
Ship containers are stacked at the Panama Canal Balboa port in Panama City, Saturday, Sept. 20, 2025. The Panama Canals is one of the most significant trade infrastructure projects ever built. CP Images photo
From the Canadian Energy Centre
Q&A with Gary Mar, CEO of the Canada West Foundation
Building a stronger Canadian economy depends as much on how we move goods as on what we produce.
Gary Mar, CEO of the Canada West Foundation, says economic corridors — the networks that connect producers, ports and markets — are central to the nation-building projects Canada hopes to realize.
He spoke with CEC about how these corridors work and what needs to change to make more of them a reality.

Gary Mar, CEO of the Canada West Foundation. Photo for the Canadian Energy Centre
CEC: What is an economic corridor, and how does it function?
Gary Mar: An economic corridor is a major artery connecting economic actors within a larger system.
Consider the road, rail and pipeline infrastructure connecting B.C. to the rest of Western Canada. This infrastructure is an important economic corridor facilitating the movement of goods, services and people within the country, but it’s also part of the economic corridor connecting western producers and Asian markets.
Economic corridors primarily consist of physical infrastructure and often combine different modes of transportation and facilities to assist the movement of many kinds of goods.
They also include social infrastructure such as policies that facilitate the easy movement of goods like trade agreements and standardized truck weights.
The fundamental purpose of an economic corridor is to make it easier to transport goods. Ultimately, if you can’t move it, you can’t sell it. And if you can’t sell it, you can’t grow your economy.
CEC: Which resources make the strongest case for transport through economic corridors, and why?
Gary Mar: Economic corridors usually move many different types of goods.
Bulk commodities are particularly dependent on economic corridors because of the large volumes that need to be transported.
Some of Canada’s most valuable commodities include oil and gas, agricultural commodities such as wheat and canola, and minerals such as potash.

Rail cars carry commodities through Saskatchewan. Photo courtesy CN Rail
CEC: How are the benefits of an economic corridor measured?
Gary Mar: The benefits of economic corridors are often measured via trade flows.
For example, the upcoming Roberts Bank Terminal 2 in the Port of Vancouver will increase container trade capacity on Canada’s west coast by more than 30 per cent, enabling the trade of $100 billion in goods annually, primarily to Asian markets.
Corridors can also help make Canadian goods more competitive, increasing profits and market share across numerous industries. Corridors can also decrease the costs of imported goods for Canadian consumers.
For example, after the completion of the Trans Mountain Expansion in May 2024 the price differential between Western Canada Select and West Texas Intermediate narrowed by about US$8 per barrel in part due to increased competition for Canadian oil.
This boosted total industry profits by about 10 per cent, and increased corporate tax revenues to provincial and federal governments by about $3 billion in the pipeline’s first year of operation.
CEC: Where are the most successful examples of these around the world?
Gary Mar: That depends how you define success. The economic corridors transporting the highest value of goods are those used by global superpowers, such as the NAFTA highway that facilitates trade across Canada, the United States and Mexico.
The Suez and Panama canals are two of the most significant trade infrastructure projects ever built, facilitating 12 per cent and five per cent of global trade, respectively. Their success is based on their unique geography.
Canada’s Asia-Pacific Gateway, a coordinated system of ports, rail lines, roads, and border crossings, primarily in B.C., was a highly successful initiative that contributed to a 48 per cent increase in merchandise trade with Asia from $44 million in 2006 to $65 million in 2015.
China’s Belt and Road initiative to develop trade infrastructure in other countries is already transforming global trade. But the project is as much about extending Chinese influence as it is about delivering economic returns.

Piles of coal awaiting export and gantry cranes used to load and unload containers onto and from cargo ships are seen at Deltaport, in Tsawwassen, B.C., on Monday, September 9, 2024. CP Images photo
CEC: What would need to change in Canada in terms of legislation or regulation to make more economic corridors a reality?
Gary Mar: A major regulatory component of economic corridors is eliminating trade barriers.
The federal Free Trade and Labour Mobility in Canada Act is a good start, but more needs to be done at the provincial level to facilitate more internal trade.
Other barriers require coordinated regulatory action, such as harmonizing weight restrictions and road bans to streamline trucking.
By taking a systems-level perspective – convening a national forum where Canadian governments consistently engage on supply chains and trade corridors – we can identify bottlenecks and friction points in our existing transportation networks, and which investments would deliver the greatest return on investment.

National Crisis Approaching Due To The Carney Government’s Centrally Planned Green Economy
Carney fails to undo Trudeau’s devastating energy policies

Climate Climbdown: Sacrificing the Canadian Economy for Net-Zero Goals Others Are Abandoning

Lawsuit Claims Google Secretly Used Gemini AI to Scan Private Gmail and Chat Data
-
 Business1 day ago
Blacked-Out Democracy: The Stellantis Deal Ottawa Won’t Show Its Own MPs
-
 Alberta2 days ago
Premier Danielle Smith says attacks on Alberta’s pro-family laws ‘show we’ve succeeded in a lot of ways’
-
 Agriculture1 day ago
Health Canada pauses plan to sell unlabeled cloned meat
-
 Artificial Intelligence2 days ago
Google denies scanning users’ email and attachments with its AI software
-
 Alberta2 days ago
New pipeline from Alberta would benefit all Canadians—despite claims from B.C. premier
-
 Crime1 day ago
B.C.’s First Money-Laundering Sentence in a Decade Exposes Gaps in Global Hub for Chinese Drug Cash
-
 COVID-192 days ago
Crown seeks to punish peaceful protestor Chris Barber by confiscating his family work truck “Big Red”
-
 International1 day ago
America first at the national parks: Trump hits Canadians and other foreign visitors with $100 fee