Business
Three ‘hard truths’ about Canada’s trade


From the Fraser Institute
Author: Jock Finlayson
In Canada’s case, a small number of sectors reliably generate significant trade surpluses, which help finance large trade deficits incurred in other parts of our economy.
Canada is an “open” economy that depends on cross-border flows of trade, investment and data/knowledge to maintain high living standards. To pay our way in a very competitive world, Canadians must produce and sell goods and services to customers in other countries. These exports furnish the means to pay for the vast array of imports that contribute to the well-being of Canadian households and allow our businesses to operate efficiently and grow by accessing bigger markets.
In 2022, Canada exported $779 billion of goods to other countries, along with $161 billion of services, for a total of $940 billion. The services category includes a wide array of commercial services including professional, scientific, technical, digital and financial, as well as transportation services and international tourism (when non-Canadian visitors travel to spend money here).
About three-quarters of Canada’s exports are destined for a single market—the United States, whose economy has steadily expanded in size over time to reach some US$25 trillion of gross domestic product today. Canada also sources the bulk of our imports from the U.S.
The centrality of the American market to Canada’s economic prosperity is the first “hard truth” about Canada’s trade, a point explored in a recent paper by Steve Globerman. Despite periodic efforts to diversify Canada’s trade and commercial links over the last 50 years, Canada remains as closely tied to the American economy today as we were in the 1990s. There’s little reason to believe the Trudeau government’s recently unveiled “Indo-Pacific” strategy will change the situation. Proximity, a common language and business culture, and the impact of extensive and unusually deep business and personal ties all serve to reinforce the American-centric character of Canada’s trade. It follows that the U.S. should continue to figure prominently in the trade promotion and investment attraction activities of Canadian governments.
A second “hard truth” about Canada’s trade is the outsized place of natural resource-based products in the export mix. The first table below breaks down Canada’s goods and services exports in 2022 into the main groupings.

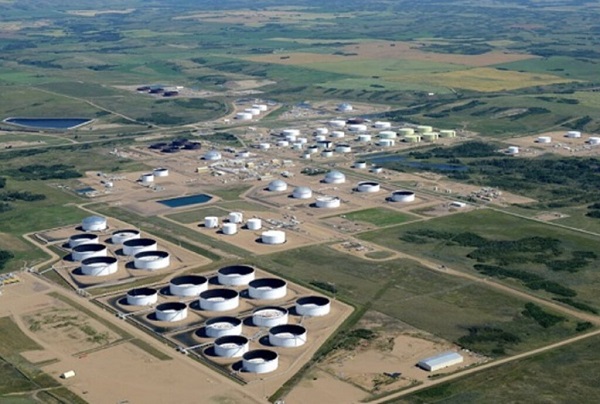
Added together, energy, non-metallic minerals and related products, metal ores, forest products and agri-food comprise almost half of the country’s total international exports of goods and services combined. Energy alone supplied 27 per cent of Canada’s merchandise exports (and 23 per cent of total exports) last year, generating a remarkable $212 billion in export-driven income for Canadian businesses, workers and governments.
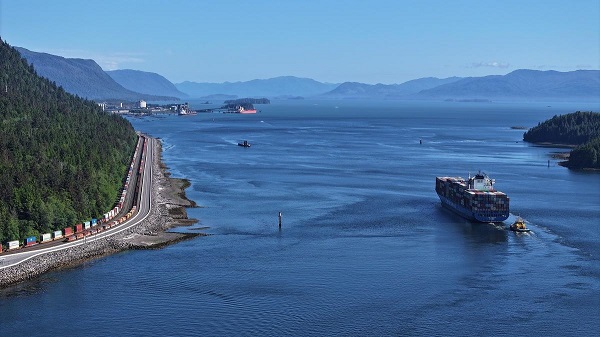
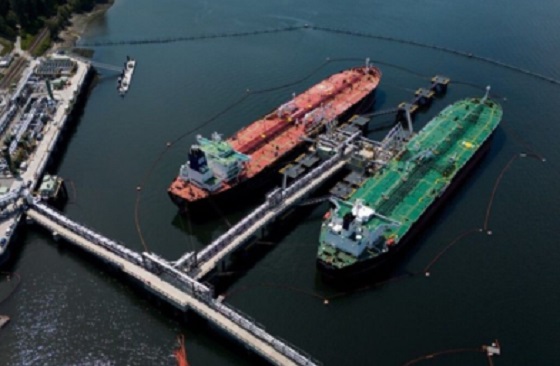
Within the energy basket, oil and oil-based products dominate, providing about three-quarters of energy-based export revenues. Contrary to innumerable speeches and press releases issued by the current federal government, the energy share is likely to rise in the next several years, as LNG production from British Columbia comes on-line and Western Canadian oil exports increase following the completion of pipeline expansion projects.
The final “hard truth” is closely related to the second but carries a more nuanced message. Ultimately, every country will have a ledger showing the trade surpluses and trade deficits across its various industries. In Canada’s case, a small number of sectors reliably generate significant trade surpluses, which help finance large trade deficits incurred in other parts of our economy.
The second table provides a snapshot of Canada’s trade “balances”—the mix of deficits and surpluses by broad industry category.

The story is a fairly simple one; positive trade balances in the energy, mining, forestry and agri-food sectors offset chronic—and in some cases very sizable—trade deficits in consumer goods, chemicals and plastics, motor vehicles/parts, and industrial and electronic goods. We also run a smallish deficit in our overall services trade.
The trade data are informative. Among other things, they tell us where Canada has, in the language of economists, a “comparative advantage” in the global context. For a market-based economy, a pattern of positive trade balances is evidence that it very likely enjoys a comparative advantage in the industries which report consistent trade surpluses. Armed with such information, smart policymakers should strive to create and sustain an attractive business and investment climate for the industries that produce trade surpluses. Unfortunately, this is a lesson that today’s federal government in distant Ottawa has struggled to digest.

This article supplied by Troy Media.
The supply management system is cracking. With imports climbing, strict quotas in place and Bill C202 on the table, we’re struggling to feed ourselves
Canada’s supply management system, once seen as a pillar of food security and agricultural self-sufficiency, is failing at its most basic function:
ensuring a reliable domestic supply.
According to the Canadian Association of Regulated Importers, Canada imported more than 66.9 million kilograms of chicken as of June 14, a 54.6 per cent increase from the same period last year. That’s enough to feed 3.4 million Canadians for a full year based on average poultry consumption—roughly 446 million meals. Under a tightly managed quota system, those meals were supposed to be produced domestically. Instead imports now account for more than 12 per cent of this year’s domestic chicken production, revealing a growing dependence on foreign supply.
Supply management is Canada’s system for regulating dairy, poultry and egg production. It uses quotas and fixed prices to match domestic supply with demand while limiting imports, intended to protect farmers from global price swings and ensure stable supply.
To be fair, the avian influenza outbreak has disrupted poultry production and partially explains the shortfall. But even with that disruption, the numbers are staggering. Imports under trade quotas set by the World Trade Organization, the Canada-United States Mexico Agreement and the Comprehensive and Progressive Agreement for Trans-Pacific Partnership are running at or near their allowable monthly share—known as pro-rata
levels—signalling not just opportunity, but urgency. Supplementary import permits, meant to be used only in emergencies, have already surpassed 48 million kilograms, exceeding total annual import volumes in some previous years. This isn’t a seasonal hiccup. It’s a systemic failure.
The system, designed to buffer domestic markets from global volatility, is cracking under internal strain. When emergency imports become routine, we have to ask: what exactly is being managed?
Canada’s most recent regulated chicken production cycle, which ended May 31, saw one of the worst shortfalls in over 50 years. Strict quota limits stopped farmers from producing more to meet demand, leaving consumers with higher grocery bills and more imported food, shaking public confidence in the system.
Some defenders insist this is an isolated event. It’s not. For the second straight week, Canada has hit pro-rata import levels across all chicken categories. Bone-in and processed poultry, once minor players in emergency import programs, are now essential just to keep shelves stocked.
And the dysfunction doesn’t stop at chicken. Egg imports under the shortage allocation program have already topped 14 million dozen, a 104 per cent jump from last year. Not long ago, Canadians were mocking high U.S. egg prices. Now theirs have fallen. Ours haven’t.
All this in a country with $30 billion in quota value, supposedly designed to protect domestic production and reduce reliance on imports. Instead, we’re importing more and paying more.
Rather than addressing these failures, Ottawa is looking to entrench them. Bill C202, now before the Senate, seeks to shield supply management from future trade talks, making reform even harder. So we must ask: is this really what we’re protecting?
Meanwhile, our trading partners are taking full advantage. Chile, for instance, has increased chicken exports to Canada by more than 63 per cent, now accounting for nearly 96 per cent of CPTPP-origin imports. While Canada doubles down on protectionism, others are gaining long-term footholds in our market.
It’s time to face the facts. Supply management no longer guarantees supply. When a system meant to ensure resilience becomes a source of fragility, it’s no longer an asset—it’s an economic liability.
Dr. Sylvain Charlebois is a Canadian professor and researcher in food distribution and policy. He is senior director of the Agri-Food Analytics Lab at Dalhousie University and co-host of The Food Professor Podcast. He is frequently cited in the media for his insights on food prices, agricultural trends, and the global food supply chain.
Troy Media empowers Canadian community news outlets by providing independent, insightful analysis and commentary. Our mission is to support local media in helping Canadians stay informed and engaged by delivering reliable content that strengthens community connections and deepens understanding across the country.
Business
Prairie provinces and Newfoundland and Labrador see largest increases in size of government

From the Fraser Institute
By Jake Fuss and Grady Munro
A recent study found that Canada has experienced one of the largest increases in the size of government of any advanced country over the last decade. But within Canada, which provinces have led the way?
The size of government refers to the extent to which resources within the economy are controlled and directed by the government, and has important implications for economic growth, living standards, and economic freedom—the degree to which people are allowed to make their own economic choices.
Too much of anything can be harmful, and this is certainly true regarding the size of government. When government grows too large it begins to take on roles and resources that are better left to the private sector. For example, rather than focusing on core functions like maintaining the rule of law or national defence, a government that has grown too large might begin subsidizing certain businesses and industries over others (i.e. corporate welfare) in order to pick winners and losers in the market. As a result, economic growth slows and living standards are lower than they otherwise would be.
One way to measure the size of government is by calculating total general government spending as a share of the economy (GDP). General government spending refers to spending by governments at all levels (federal, provincial, and municipal), and by measuring this as a share of gross domestic product (GDP) we can compare across jurisdictions of different sizes.
A recent study compared the size of government in Canada as a whole with that of 39 other advanced economies worldwide, and found that Canada experienced the second-largest increase in the size of government (as a share of the economy) from 2014 to 2024. In other words, since 2014, governments in Canada have expanded their role within the economy faster than governments in virtually every other advanced country worldwide—including all other countries within the Group of Seven (France, Germany, Italy, Japan, the United Kingdom, and the United States). Moreover, the study showed that Canada as a whole has exceeded the optimal size of government (estimated to fall between 24 and 32 per cent of GDP) at which a country can maximize their economic growth. Beyond that point, growth slows and is lower than it otherwise would be.
However, Canada is a decentralized country and provinces vary as to the extent to which governments direct overall economic activity. Using data from Statistics Canada, the following charts illustrate which provinces in Canada have the largest size of government and which have seen the largest increases since 2014.

The chart above shows total general government spending as a share of GDP for all ten provinces in 2023 (the latest year of available provincial data). The size of government in the provinces varies considerably, ranging from a high of 61.4 per cent in Nova Scotia to a low of 30.0 per cent in Alberta. There are geographical differences, as three Atlantic provinces (Nova Scotia, Prince Edward Island, and New Brunswick) have the largest governments while the three western-most provinces (Alberta, Saskatchewan, and British Columbia) have the smallest governments. However, as of 2023, all provinces except Alberta exceeded the optimal size of government—which again, is between 24 and 32 per cent of the economy.

To show which provinces have experienced the greatest increase in the size of government in recent years, the second chart shows the percentage point increase in total general government spending as a share of GDP from 2014 to 2023. It should be noted that this is measuring the expansion of the federal government’s role in the economy—which has been substantial nationwide—as well as growth in the respective provincial and municipal governments.
The increases in the size of government since 2014 are largest in four provinces: Newfoundland and Labrador (10.82 percentage points), Alberta (7.94 percentage points), Saskatchewan (7.31 percentage points), and Manitoba (7.17 percentage points). These are all dramatic increases—for perspective, in the study referenced above, Estonia’s 6.66 percentage point increase in its size of government was the largest out of 40 advanced countries.
The remaining six provinces experienced far lower increases in the size of government, ranging from a 2.74 percentage point increase in B.C. to a 0.44 percentage point increase in Quebec. However, since 2014, every province in Canada has seen government expand its role within the economy.
Over the last decade, Canada has experienced a substantial increase in the size of total government. Within the country, Newfoundland and Labrador and the three Prairie provinces have led the way in growing their respective governments.


Ontario man launches new challenge against province’s latest attempt to ban free expression on roadside billboards

Ottawa Funded the China Ferry Deal—Then Pretended to Oppose It

New Peer-Reviewed Study Affirms COVID Vaccines Reduce Fertility

This Canada Day, Celebrate Energy Renewal
-
 Business2 days ago
Latest shakedown attempt by Canada Post underscores need for privatization
-
 Business2 days ago
Why it’s time to repeal the oil tanker ban on B.C.’s north coast
-
 Alberta2 days ago
Pierre Poilievre – Per Capita, Hardisty, Alberta Is the Most Important Little Town In Canada
-
 Alberta1 day ago
Alberta Provincial Police – New chief of Independent Agency Police Service
-
 Energy2 days ago
If Canada Wants to be the World’s Energy Partner, We Need to Act Like It
-
 MxM News2 days ago
UPenn strips Lia Thomas of women’s swimming titles after Title IX investigation
-
 COVID-191 day ago
Top COVID doctor given one of Canada’s highest honors
-
 Crime2 days ago
Bryan Kohberger avoids death penalty in brutal killing of four Idaho students