Canadian Energy Centre
A Matter of Fact: The IEA’s updated net zero scenario is still unrealistic
From the Canadian Energy Centre
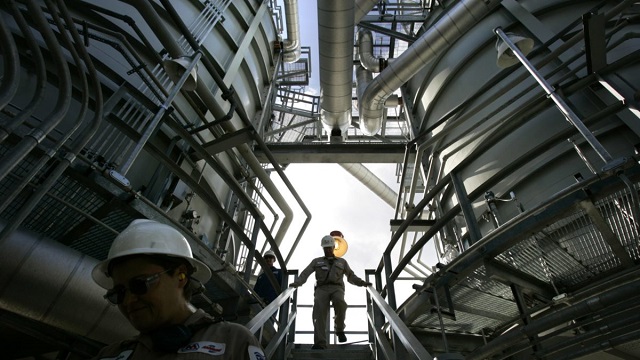
By Deborah JaremkoCanada can lead the world with reliable, affordable energy supply and clean technology as countries work to reduce emissions
The International Energy Agency (IEA) has updated its net zero scenario, pushing for governments to implement more aggressive climate policies on the energy industry.
The IEA itself acknowledges the scenario is “a pathway, but not the only one” for the energy sector to reduce emissions to net zero by 2050.
The agency acknowledges the world is not on this trajectory, but the Government of Canada uses the net zero scenario as the basis for policies like its proposed oil and gas emissions cap, which will hurt Canadians without environmental gain.
“We’re the fourth-largest oil producing country, and we’re the only ones that are saying oil and gas is not here to stay. That’s a huge roadblock for all of us,” Gurpreet Lail, CEO of Enserva, the national trade organization representing energy service and supply companies, told the Globe and Mail during the World Petroleum Congress last week.
Canada can lead the world with reliable, affordable energy supply and clean technology as countries work to reduce emissions. But the sector needs to be allowed to thrive rather than being phased out while it is needed.
Here are the facts.
Fact: The IEA net zero scenario is not a forecast
The IEA’s updated net zero scenario envisions that the world does not need any new coal, oil and natural gas projects. By 2030, it imagines world oil demand will drop by 23 per cent, natural gas demand by 18 per cent, and coal demand by 44 per cent.
It’s difficult to see how this could actually come about, given that even with accelerating investment in low carbon energy resources the world’s consumption of oil, gas and coal is as high or higher than it has ever been. And rising.
The IEA reports both oil and coal demand are at record levels. The agency itself projects the world’s total energy consumption – which increased by 15 per cent over the last decade – will increase by a further 24 per cent by 2050.
On the world’s current trajectory, the IEA says oil, gas and coal will still account for 62 per cent of world energy supply in 2050, compared to 78 per cent in 2021.
“There’s no evidence that oil demand is going to peak any time soon,” Arjun Murti, former partner with Goldman Sachs, said at the recent Global Business Forum in Banff.
“Oil is not in its sunset phase.”
Fact: The IEA net zero scenario is unrealistic
The IEA’s net zero scenario includes components that are unrealistic.
For example, it says electricity transmission and distribution grids need to expand by around two million kilometres each year to 2030. But it also acknowledges that today, building these grids can take more than a decade, putting that scale and timeline already out of reach.
The net zero scenario also hinges on a “unified effort in which governments put tensions aside and find ways to work together.” But the IEA also acknowledges the world today is “a complex and low-trust geopolitical environment.”
Consider that Russia is trying to boost trade with Asia as economic ties with the West shrivel over Moscow’s actions in Ukraine, according to Reuters News. In just one example, state-owned Gazprom plans to start gas deliveries to China through the Power of Siberia pipeline in 2025 and expand that service in 2030 with Power of Siberia-2.
Russia’s invasion of Ukraine accentuated the world’s reversal away from the concept of globalization, where everyone benefits from the global economy, leading energy analyst and Pulitzer Prize-winning author Daniel Yergin said on a recent ARC Energy Ideas podcast.
“The era of globalization was what I call the WTO consensus: we’re all in this global economy together. In China, hundreds of millions of people come out of poverty. India enters the global economy, standards of living go up and you get really impressive economic performance,” Yergin said.
“Well, that era is ending and it’s heading pretty fast now as we move into this new era of great power competition, which hopefully does not become great power confrontation.”
Energy is at the heart of the “new map,” as Yergin calls it.
Responsibly produced, reliable energy from Canada can benefit world energy security while helping reduce emissions. That is why it is essential the sector is not phased out through government policy.
Fact: Canadian energy and clean technology can help reduce world emissions
One of the fastest and most effective ways to reduce emissions is to switch from coal-fired power to power generated from natural gas, traded globally as LNG.
Consider that between 2005 and 2019, emissions from the U.S power sector dropped by 32 per cent because of coal-to-gas switching, according to the U.S. Energy Information Administration.
Natural gas from the LNG Canada project alone could reduce emissions in Asia by up to 90 million tonnes annually, or the equivalent of shutting down up to 60 Asian coal plants, the project says.
That’s a reduction of more than the entire emissions of the province of British Columbia, which were 64 million tonnes in 2022.
Expanding Canada’s LNG exports to Asia could reduce emissions by 188 million tonnes per year, or the annual equivalent of taking all internal combustion engine vehicles off Canadian roads, according to a 2022 study by Wood Mackenzie.
One of the reasons LNG from Canada has a lower emissions intensity than LNG from other jurisdictions is the success producers have seen reducing methane emissions. It’s an opportunity for technology exports.
The IEA views cutting methane emissions from oil and gas as a critical component of achieving climate targets.
The latest data shows that oil and gas producers in Alberta decreased methane emissions by 44 per cent between 2014 and 2021, a 10 per cent drop from 2020. The sector is expected to surpass the target of reducing methane emissions by 45 per cent by 2025.
“I don’t know of any other jurisdiction that is as far forward in terms of its methane management as Canada,” says Allan Fogwill, chief operating officer of Petroleum Technology Alliance Canada.
“There’s nothing to suggest we couldn’t have similar impacts in the United States, the Middle East, or former Soviet countries that also are involved in oil and natural gas production.”
Fact: Canada’s carbon capture and storage leadership can benefit the world
The IEA says “rapid progress” is required to deploy more carbon capture, utilization and storage (CCUS) projects to reduce emissions.
This is another area where Canada’s energy sector can take the lead.
Since 2000, CCS projects in Saskatchewan and Alberta have removed more than 47 million tonnes of emissions, or the equivalent of taking more than 10 million cars off the road. This work has helped inform development of major CCS projects globally including Northern Lights in Norway.
Canada has five of the world’s 30 commercial CCS facilities, accounting for about 15 per cent of global CCS capacity even though Canada generates less than two per cent of global CO2 emissions, according to the Global CCS Knowledge Centre.
Among CCS projects under development in Canada is one of the largest in the world, proposed by the Pathways Alliance of oil sands producers.
The first phase of the Pathways CCS project will connect 14 oil sands facilities to a CO2 storage hub in northern Alberta. The target is to reduce emissions from operations by 22 megatonnes by 2030 on the way to net zero in 2050.
Fact: Oil and gas still needed in IEA net zero scenario
Even in the IEA’s net zero scenario, in 2050 about 14 per cent of world energy needs are still supplied by oil and gas.
This includes non-combustion uses like petrochemical feedstock and asphalt, which crude from Canada’s oil sands is particularly well suited to supply. Researchers with Queen’s University recently found that asphalt from Alberta’s oil sands can extend pavement lifespan by 30 to 50 per cent.
The world needs more Canadian oil and gas, not less.
Canadian Energy Centre
Cross-Canada economic benefits of the proposed Northern Gateway Pipeline project
From the Canadian Energy Centre
Billions in government revenue and thousands of jobs across provinces
Announced in 2006, the Northern Gateway project would have built twin pipelines between Bruderheim, Alta. and a marine terminal at Kitimat, B.C.
One pipeline would export 525,000 barrels per day of heavy oil from Alberta to tidewater markets. The other would import 193,000 barrels per day of condensate to Alberta to dilute heavy oil for pipeline transportation.
The project would have generated significant economic benefits across Canada.

The following projections are drawn from the report Public Interest Benefits of the Northern Gateway Project (Wright Mansell Research Ltd., July 2012), which was submitted as reply evidence during the regulatory process.
Financial figures have been adjusted to 2025 dollars using the Bank of Canada’s Inflation Calculator, with $1.00 in 2012 equivalent to $1.34 in 2025.
Total Government Revenue by Region
Between 2019 and 2048, a period encompassing both construction and operations, the Northern Gateway project was projected to generate the following total government revenues by region (direct, indirect and induced):

British Columbia
- Provincial government revenue: $11.5 billion
- Federal government revenue: $8.9 billion
- Total: $20.4 billion
Alberta
- Provincial government revenue: $49.4 billion
- Federal government revenue: $41.5 billion
- Total: $90.9 billion
Ontario
- Provincial government revenue: $1.7 billion
- Federal government revenue: $2.7 billion
- Total: $4.4 billion
Quebec
- Provincial government revenue: $746 million
- Federal government revenue: $541 million
- Total: $1.29 billion
Saskatchewan
- Provincial government revenue: $6.9 billion
- Federal government revenue: $4.4 billion
- Total: $11.3 billion
Other
- Provincial government revenue: $1.9 billion
- Federal government revenue: $1.4 billion
- Total: $3.3 billion
Canada
- Provincial government revenue: $72.1 billion
- Federal government revenue: $59.4 billion
- Total: $131.7 billion
Annual Government Revenue by Region
Over the period 2019 and 2048, the Northern Gateway project was projected to generate the following annual government revenues by region (direct, indirect and induced):

British Columbia
- Provincial government revenue: $340 million
- Federal government revenue: $261 million
- Total: $601 million per year
Alberta
- Provincial government revenue: $1.5 billion
- Federal government revenue: $1.2 billion
- Total: $2.7 billion per year
Ontario
- Provincial government revenue: $51 million
- Federal government revenue: $79 million
- Total: $130 million per year
Quebec
- Provincial government revenue: $21 million
- Federal government revenue: $16 million
- Total: $37 million per year
Saskatchewan
- Provincial government revenue: $204 million
- Federal government revenue: $129 million
- Total: $333 million per year
Other
- Provincial government revenue: $58 million
- Federal government revenue: $40 million
- Total: $98 million per year
Canada
- Provincial government revenue: $2.1 billion
- Federal government revenue: $1.7 billion
- Total: $3.8 billion per year
Employment by Region
Over the period 2019 to 2048, the Northern Gateway Pipeline was projected to generate the following direct, indirect and induced full-time equivalent (FTE) jobs by region:

British Columbia
- Annual average: 7,736
- Total over the period: 224,344
Alberta
- Annual average: 11,798
- Total over the period: 342,142
Ontario
- Annual average: 3,061
- Total over the period: 88,769
Quebec
- Annual average: 1,003
- Total over the period: 29,087
Saskatchewan
- Annual average: 2,127
- Total over the period: 61,683
Other
- Annual average: 953
- Total over the period: 27,637
Canada
- Annual average: 26,678
- Total over the period: 773,662
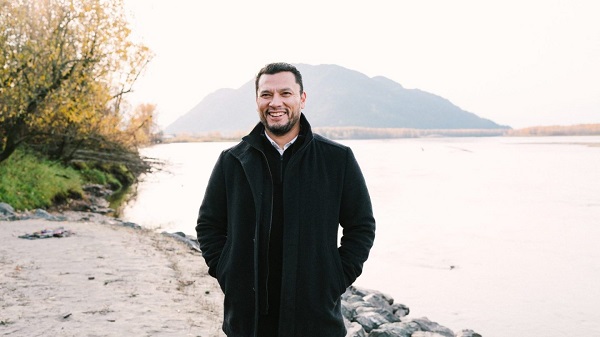
Chief David Jimmie is president of Stonlasec8 and Chief of Squiala First Nation in B.C. He also chairs the Western Indigenous Pipeline Group. Photo courtesy Western Indigenous Pipeline Group
From the Canadian Energy Centre
Stonlasec8 agreement is Canada’s first federal Indigenous loan guarantee
The first federally backed Indigenous loan guarantee paves the way for increased prosperity for 36 First Nations communities in British Columbia.
In May, Canada Development Investment Corporation (CDEV) announced a $400 million backstop for the consortium to jointly purchase 12.5 per cent ownership of Enbridge’s Westcoast natural gas pipeline system for $712 million.
In the works for two years, the deal redefines long-standing relationships around a pipeline that has been in operation for generations.
“For 65 years, there’s never been an opportunity or a conversation about participating in an asset that’s come through the territory,” said Chief David Jimmie of the Squiala First Nation near Vancouver, B.C.
“We now have an opportunity to have our Nation’s voices heard directly when we have concerns and our partners are willing to listen.”
Jimmie chairs the Stonlasec8 Indigenous Alliance, which represents the communities buying into the Enbridge system.
The name Stonlasec8 reflects the different regions represented in the agreement, he said.
The Westcoast pipeline stretches more than 2,900 kilometres from northeast B.C. near the Alberta border to the Canada-U.S. border near Bellingham, Wash., running through the middle of the province.

It delivers up to 3.6 billion cubic feet per day of natural gas throughout B.C. and the Lower Mainland, Alberta and the U.S. Pacific Northwest.
“While we see the benefits back to communities, we are still reminded of our responsibility to the land, air and water so it is important to think of reinvestment opportunities in alternative energy sources and how we can offset the carbon footprint,” Jimmie said.
He also chairs the Western Indigenous Pipeline Group (WIPG), a coalition of First Nations communities working in partnership with Pembina Pipeline to secure an ownership stake in the newly expanded Trans Mountain pipeline system.
There is overlap between the communities in the two groups, he said.
CDEV vice-president Sébastien Labelle said provincial models such as the Alberta Indigenous Opportunities Corporation (AIOC) and Ontario’s Indigenous Opportunities Financing Program helped bring the federal government’s version of the loan guarantee to life.
“It’s not a new idea. Alberta started it before us, and Ontario,” Labelle said.
“We hired some of the same advisors AIOC hired because we want to make sure we are aligned with the market. We didn’t want to start something completely new.”
Broadly, Jimmie said the Stonlasec8 agreement will provide sustained funding for investments like housing, infrastructure, environmental stewardship and cultural preservation. But it’s up to the individual communities how to spend the ongoing proceeds.
The long-term cash injections from owning equity stakes of major projects can provide benefits that traditional funding agreements with the federal government do not, he said.
Labelle said the goal is to ensure Indigenous communities benefit from projects on their traditional territories.
“There’s a lot of intangible, indirect things that I think are hugely important from an economic perspective,” he said.
“You are improving the relationship with pipeline companies, you are improving social license to do projects like this.”
Jimmie stressed the impact the collaborative atmosphere of the negotiations had on the success of the Stonlasec8 agreement.
“It takes true collaboration to reach a successful partnership, which doesn’t always happen. And from the Nation representation, the sophistication of the group was one of the best I’ve ever worked with.”

How Chinese State-Linked Networks Replaced the Medellín Model with Global Logistics and Political Protection

We need an immigration policy that will serve all Canadians
New RCMP program steering opioid addicted towards treatment and recovery
Natural gas pipeline ownership spreads across 36 First Nations in B.C.

-
Crime24 hours ago
How Chinese State-Linked Networks Replaced the Medellín Model with Global Logistics and Political Protection
-
Aristotle Foundation1 day ago
We need an immigration policy that will serve all Canadians
-
 Addictions1 day ago
New RCMP program steering opioid addicted towards treatment and recovery
-
Business23 hours ago
Natural gas pipeline ownership spreads across 36 First Nations in B.C.
-
 Courageous Discourse21 hours ago
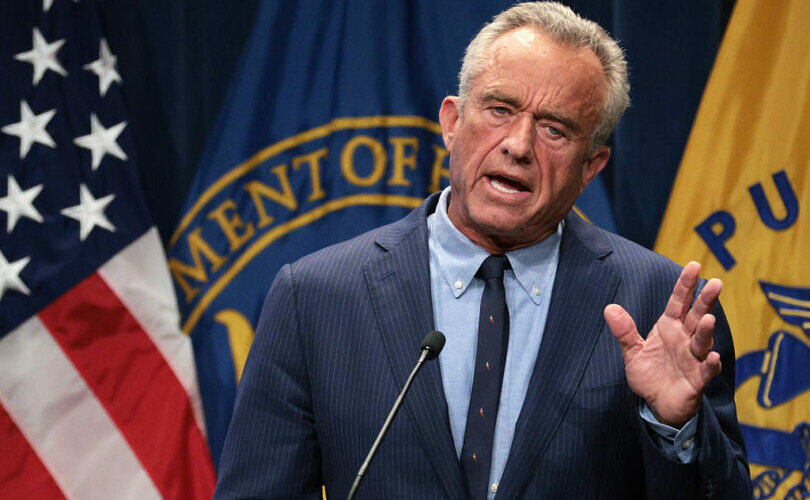
Healthcare Blockbuster – RFK Jr removes all 17 members of CDC Vaccine Advisory Panel!
-
 Business3 hours ago
EU investigates major pornographic site over failure to protect children
-
 Health17 hours ago
RFK Jr. purges CDC vaccine panel, citing decades of ‘skewed science’
-
 Censorship Industrial Complex20 hours ago
Alberta senator wants to revive lapsed Trudeau internet censorship bill