Canadian Energy Centre
Report: Oil sands, Montney growth key to meet rising world energy demand
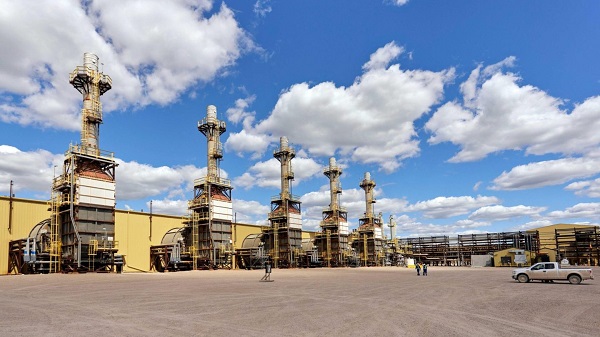

Cenovus Energy’s Sunrise oil sands project in northern Alberta
From the Canadian Energy Centre
By Will Gibson
‘Canada continues to be resource-rich and competes very well against major U.S. resource bases’
A new report on North American energy highlights the important role that Canada’s oil sands and Montney natural gas resources play in supplying growing global energy demand.
In its annual North American supply outlook, Calgary-based Enverus Intelligence Research (a subsidiary of Enverus, which is headquartered in Texas and also operates in Europe and Asia) forecasts that by 2030, the world will require an additional seven million barrels per day (bbl/d) of oil and another 40 billion cubic feet per day (bcf/d) of natural gas.
“North America is one of the few regions where we’ve seen meaningful growth in the past 20 years,” said Enverus supply forecasting analyst Alex Ljubojevic.
Since 2005, North America has added 15 million bbl/d of liquid hydrocarbons and 50 bcf/d of gas production to the global market.
Enverus projects that by the end of this decade, that could grow by a further two million bbl/d of liquids and 15 bcf/d of natural gas if the oil benchmark WTI stays between US$70 and $80 per barrel and the natural gas benchmark Henry Hub stays between US$3.50 and $4 per million British thermal unit.

Ljubojevic said the oil sands in Alberta and the Montney play straddling Alberta and B.C.’s northern boarder are key assets because of their low cost structures and long-life resource inventories.
“Canada continues to be resource-rich and competes very well against major U.S. resource bases. Both the Montney and oil sands have comparable costs versus key U.S. basins such as the Permian,” he said.
“In the Montney, wells are being drilled longer and faster. In the oil sands, the big build outs of infrastructure have taken place. The companies are now fine-tuning those operations, making small improvements year-on-year [and] operators have continued to reduce their operating costs. Investment dollars will always flow to the lowest cost plays,” he said.
“Are the Montney and oil sands globally significant? Yes, and we expect that will continue to be the case moving forward.”

From the Canadian Energy Centre
By Will Gibson
Oil sands could maintain current production rates for more than 140 years
Investor interest in Canadian oil producers, primarily in the Alberta oil sands, has picked up, and not only because of expanded export capacity from the Trans Mountain pipeline.
Enverus Intelligence Research says the real draw — and a major factor behind oil sands equities outperforming U.S. peers by about 40 per cent since January 2024 — is the resource Trans Mountain helps unlock.
Alberta’s oil sands contain 167 billion barrels of reserves, nearly four times the volume in the United States.
Today’s oil sands operators hold more than twice the available high-quality resources compared to U.S. shale producers, Enverus reports.
“It’s a huge number — 167 billion barrels — when Alberta only produces about three million barrels a day right now,” said Mike Verney, executive vice-president at McDaniel & Associates, which earlier this year updated the province’s oil and gas reserves on behalf of the Alberta Energy Regulator.
Already fourth in the world, the assessment found Alberta’s oil reserves increased by seven billion barrels.
Verney said the rise in reserves despite record production is in part a result of improved processes and technology.
“Oil sands companies can produce for decades at the same economic threshold as they do today. That’s a great place to be,” said Michael Berger, a senior analyst with Enverus.
BMO Capital Markets estimates that Alberta’s oil sands reserves could maintain current production rates for more than 140 years.
The long-term picture looks different south of the border.
The U.S. Energy Information Administration projects that American production will peak before 2030 and enter a long period of decline.
Having a lasting stable source of supply is important as world oil demand is expected to remain strong for decades to come.
This is particularly true in Asia, the target market for oil exports off Canada’s West Coast.
The International Energy Agency (IEA) projects oil demand in the Asia-Pacific region will go from 35 million barrels per day in 2024 to 41 million barrels per day in 2050.
The growing appeal of Alberta oil in Asian markets shows up not only in expanded Trans Mountain shipments, but also in Canadian crude being “re-exported” from U.S. Gulf Coast terminals.
According to RBN Energy, Asian buyers – primarily in China – are now the main non-U.S. buyers from Trans Mountain, while India dominates purchases of re-exports from the U.S. Gulf Coast. .
BMO said the oil sands offers advantages both in steady supply and lower overall environmental impacts.
“Not only is the resulting stability ideally suited to backfill anticipated declines in world oil supply, but the long-term physical footprint may also be meaningfully lower given large-scale concentrated emissions, high water recycling rates and low well declines,” BMO analysts said.
From the Canadian Energy Centre
For Canada, the path to a stronger economy — and stronger global influence — runs through energy.
That’s the view of David Detomasi, a professor at the Smith School of Business at Queen’s University.
Detomasi, author of Profits and Power: Navigating the Politics and Geopolitics of Oil, argues that there is a moral case for developing Canada’s energy, both for Canadians and the world.

David Detomasi. Photo courtesy Smith School of Business, Queen’s University
CEC: What does being an energy superpower mean to you?
DD: It means Canada is strong enough to affect the system as a whole by its choices.
There is something really valuable about Canada’s — and Alberta’s — way of producing carbon energy that goes beyond just the monetary rewards.
CEC: You talk about the moral case for developing Canada’s energy. What do you mean?
DD: I think the default assumption in public rhetoric is that the environmental movement is the only voice speaking for the moral betterment of the world. That needs to be challenged.
That public rhetoric is that the act of cultivating a powerful, effective economic engine is somehow wrong or bad, and that efforts to create wealth are somehow morally tainted.
I think that’s dead wrong. Economic growth is morally good, and we should foster it.
Economic growth generates money, and you can’t do anything you want to do in social expenditures without that engine.
Economic growth is critical to doing all the other things we want to do as Canadians, like having a publicly funded health care system or providing transfer payments to less well-off provinces.
Over the last 10 years, many people in Canada came to equate moral leadership with getting off of oil and gas as quickly as possible. I think that is a mistake, and far too narrow.
Instead, I think moral leadership means you play that game, you play it well, and you do it in our interest, in the Canadian way.
We need a solid base of economic prosperity in this country first, and then we can help others.
CEC: Why is it important to expand Canada’s energy trade?
DD: Canada is, and has always been, a trading nation, because we’ve got a lot of geography and not that many people.
If we don’t trade what we have with the outside world, we aren’t going to be able to develop economically, because we don’t have the internal size and capacity.
Historically, most of that trade has been with the United States. Geography and history mean it will always be our primary trade partner.
But the United States clearly can be an unreliable partner. Free and open trade matters more to Canada than it does to the U.S. Indeed, a big chunk of the American people is skeptical of participating in a global trading system.
As the United States perhaps withdraws from the international trading and investment system, there’s room for Canada to reinforce it in places where we can use our resource advantages to build new, stronger relationships.
One of these is Europe, which still imports a lot of gas. We can also build positive relationships with the enormous emerging markets of China and India, both of whom want and will need enormous supplies of energy for many decades.
I would like to be able to offer partners the alternative option of buying Canadian energy so that they are less reliant on, say, Iranian or Russian energy.
Canada can also maybe eventually help the two billion people in the world currently without energy access.
CEC: What benefits could Canadians gain by becoming an energy superpower?
DD: The first and primary responsibility of our federal government is to look after Canada. At the end of the day, the goal is to improve Canada’s welfare and enhance its sovereignty.
More carbon energy development helps Canada. We have massive debt, an investment crisis and productivity problems that we’ve been talking about forever. Economic and job growth are weak.
Solving these will require profitable and productive industries. We don’t have so many economic strengths in this country that we can voluntarily ignore or constrain one of our biggest industries.
The economic benefits pay for things that make you stronger as a country.
They make you more resilient on the social welfare front and make increasing defence expenditures, which we sorely need, more affordable. It allows us to manage the debt that we’re running up, and supports deals for Canada’s Indigenous peoples.
CEC: Are there specific projects that you advocate for to make Canada an energy superpower?
DD: Canada’s energy needs egress, and getting it out to places other than the United States. That means more transport and port facilities to Canada’s coasts.
We also need domestic energy transport networks. People don’t know this, but a big chunk of Ontario’s oil supply runs through Michigan, posing a latent security risk to Ontario’s energy security.
We need to change the perception that pipelines are evil. There’s a spiderweb of them across the globe, and more are being built.
Building pipelines here, with Canadian technology and know-how, builds our competitiveness and enhances our sovereignty.
Economic growth enhances sovereignty and provides the resources to do other things. We should applaud and encourage it, and the carbon energy sector can lead the way.


Death by a thousand clicks – government censorship of Canada’s internet

Politicians should be honest about environmental pros and cons of electric vehicles

Viral TikTok video shows 7-year-old cuddling great-grandfather before he’s euthanized

Canada releases new digital ID app for personal documents despite privacy concerns
-
Automotive9 hours ago
Politicians should be honest about environmental pros and cons of electric vehicles
-
 Agriculture2 days ago
Why is Canada paying for dairy ‘losses’ during a boom?
-
 Frontier Centre for Public Policy2 days ago
Canada Lets Child-Porn Offenders Off Easy While Targeting Bible Believers
-
 Agriculture2 days ago
Canadians should thank Trump for targeting supply management
-
 Business2 days ago
Canada Hits the Brakes on Population
-
 Business2 days ago
White House declares inflation era OVER after shock report
-
 Daily Caller1 day ago
‘Almost Sounds Made Up’: Jeffrey Epstein Was Bill Clinton Plus-One At Moroccan King’s Wedding, Per Report
-
 Crime1 day ago
Brown University shooter dead of apparent self-inflicted gunshot wound