Business
Massive government child-care plan wreaking havoc across Ontario


From the Fraser Institute
By Matthew Lau
It’s now more than four years since the federal Liberal government pledged $30 billion in spending over five years for $10-per-day national child care, and more than three years since Ontario’s Progressive Conservative government signed a $13.2 billion deal with the federal government to deliver this child-care plan.
Not surprisingly, with massive government funding came massive government control. While demand for child care has increased due to the government subsidies and lower out-of-pocket costs for parents, the plan significantly restricts how child-care centres operate (including what items participating centres may purchase), and crucially, caps the proportion of government funds available to private for-profit providers.
What have families and taxpayers got for this enormous government effort? Widespread child-care shortages across Ontario.
For example, according to the City of Ottawa, the number of children (aged 0 to 5 years) on child-care waitlists has ballooned by more than 300 per cent since 2019, there are significant disparities in affordable child-care access “with nearly half of neighbourhoods underserved, and limited access in suburban and rural areas,” and families face “significantly higher” costs for before-and-after-school care for school-age children.
In addition, Ottawa families find the system “complex and difficult to navigate” and “fewer child care options exist for children with special needs.” And while 42 per cent of surveyed parents need flexible child care (weekends, evenings, part-time care), only one per cent of child-care centres offer these flexible options. These are clearly not encouraging statistics, and show that a government-knows-best approach does not properly anticipate the diverse needs of diverse families.

Moreover, according to the Peel Region’s 2025 pre-budget submission to the federal government (essentially, a list of asks and recommendations), it “has maximized its for-profit allocation, leaving 1,460 for-profit spaces on a waitlist.” In other words, families can’t access $10-per-day child care—the central promise of the plan—because the government has capped the number of for-profit centres.
Similarly, according to Halton Region’s pre-budget submission to the provincial government, “no additional families can be supported with affordable child care” because, under current provincial rules, government funding can only be used to reduce child-care fees for families already in the program.
And according to a March 2025 Oxford County report, the municipality is experiencing a shortage of child-care staff and access challenges for low-income families and children with special needs. The report includes a grim bureaucratic predication that “provincial expansion targets do not reflect anticipated child care demand.”
Child-care access is also a problem provincewide. In Stratford, which has a population of roughly 33,000, the municipal government reports that more than 1,000 children are on a child-care waitlist. Similarly in Port Colborne (population 20,000), the city’s chief administrative officer told city council in April 2025 there were almost 500 children on daycare waitlists at the beginning of the school term. As of the end of last year, Guelph and Wellington County reportedly had a total of 2,569 full-day child-care spaces for children up to age four, versus a waitlist of 4,559 children—in other words, nearly two times as many children on a waitlist compared to the number of child-care spaces.
More examples. In Prince Edward County, population around 26,000, there are more than 400 children waitlisted for licensed daycare. In Kawartha Lakes and Haliburton County, the child-care waitlist is about 1,500 children long and the average wait time is four years. And in St. Mary’s, there are more than 600 children waitlisted for child care, but in recent years town staff have only been able to move 25 to 30 children off the wait list annually.
The numbers speak for themselves. Massive government spending and control over child care has created havoc for Ontario families and made child-care access worse. This cannot be a surprise. Quebec’s child-care system has been largely government controlled for decades, with poor results. Why would Ontario be any different? And how long will Premier Ford allow this debacle to continue before he asks the new prime minister to rethink the child-care policy of his predecessor?

Matthew Lau
Adjunct Scholar, Fraser Institute

Prince Rupert Port Authority CEO Shaun Stevenson. Photo courtesy Prince Rupert Port Authority
From the Canadian Energy Centre
A strategic gateway to the world
Tucked into the north coast of B.C. is the deepest natural harbour in North America and the port with the shortest travel times to Asia.
With growing capacity for exports including agricultural products, lumber, plastic pellets, propane and butane, it’s no wonder the Port of Prince Rupert often comes up as a potential new global gateway for oil from Alberta, said CEO Shaun Stevenson.
Thanks to its location and natural advantages, the port can efficiently move a wide range of commodities, he said.
That could include oil, if not for the federal tanker ban in northern B.C.’s coastal waters.

The Port of Prince Rupert on the north coast of British Columbia. Photo courtesy Prince Rupert Port Authority
“Notwithstanding the moratorium that was put in place, when you look at the attributes of the Port of Prince Rupert, there’s arguably no safer place in Canada to do it,” Stevenson said.
“I think that speaks to the need to build trust and confidence that it can be done safely, with protection of environmental risks. You can’t talk about the economic opportunity before you address safety and environmental protection.”
Safe Transit at Prince Rupert
About a 16-hour drive from Vancouver, the Port of Prince Rupert’s terminals are one to two sailing days closer to Asia than other West Coast ports.
The entrance to the inner harbour is wider than the length of three Canadian football fields.
The water is 35 metres deep — about the height of a 10-storey building — compared to 22 metres at Los Angeles and 16 metres at Seattle.
Shipmasters spend two hours navigating into the port with local pilot guides, compared to four hours at Vancouver and eight at Seattle.
“We’ve got wide open, very simple shipping lanes. It’s not moving through complex navigational channels into the site,” Stevenson said.
A Port on the Rise
The Prince Rupert Port Authority says it has entered a new era of expansion, strengthening Canada’s economic security.
The port estimates it anchors about $60 billion of Canada’s annual global trade today. Even without adding oil exports, Stevenson said that figure could grow to $100 billion.
“We need better access to the huge and growing Asian market,” said Heather Exner-Pirot, director of energy, natural resources and environment at the Macdonald-Laurier Institute.
“Prince Rupert seems purpose-built for that.”
Roughly $3 billion in new infrastructure is already taking shape, including the $750 million rail-to-container CANXPORT transloading complex for bulk commodities like specialty agricultural products, lumber and plastic pellets.

The Ridley Island Propane Export Terminal, Canada’s first marine propane export terminal, started shipping in May 2019. Photo courtesy AltaGas Ltd.
Canadian Propane Goes Global
A centrepiece of new development is the $1.35-billion Ridley Energy Export Facility — the port’s third propane terminal since 2019.
“Prince Rupert is already emerging as a globally significant gateway for propane exports to Asia,” Exner-Pirot said.
Thanks to shipments from Prince Rupert, Canadian propane – primarily from Alberta – has gone global, no longer confined to U.S. markets.
More than 45 per cent of Canada’s propane exports now reach destinations outside the United States, according to the Canada Energy Regulator.
“Twenty-five per cent of Japan’s propane imports come through Prince Rupert, and just shy of 15 per cent of Korea’s imports. It’s created a lift on every barrel produced in Western Canada,” Stevenson said.
“When we look at natural gas liquids, propane and butane, we think there’s an opportunity for Canada via Prince Rupert becoming the trading benchmark for the Asia-Pacific region.”
That would give Canadian production an enduring competitive advantage when serving key markets in Asia, he said.
Deep Connection to Alberta
The Port of Prince Rupert has been a key export hub for Alberta commodities for more than four decades.
Through the Alberta Heritage Savings Trust Fund, the province invested $134 million — roughly half the total cost — to build the Prince Rupert Grain Terminal, which opened in 1985.
The largest grain terminal on the West Coast, it primarily handles wheat, barley, and canola from the prairies.

The Prince Rupert Grain Terminal. Photo courtesy Prince Rupert Port Authority
Today, the connection to Alberta remains strong.
In 2022, $3.8 billion worth of Alberta exports — mainly propane, agricultural products and wood pulp — were shipped through the Port of Prince Rupert, according to the province’s Ministry of Transportation and Economic Corridors.
In 2024, Alberta awarded a $250,000 grant to the Prince Rupert Port Authority to lead discussions on expanding transportation links with the province’s Industrial Heartland region near Edmonton.
Handling Some of the World’s Biggest Vessels
The Port of Prince Rupert could safely handle oil tankers, including Very Large Crude Carriers (VLCCs), Stevenson said.
“We would have the capacity both in water depth and access and egress to the port that could handle Aframax, Suezmax and even VLCCs,” he said.
“We don’t have terminal capacity to handle oil at this point, but there’s certainly terminal capacities within the port complex that could be either expanded or diversified in their capability.”
Market Access Lessons From TMX
Like propane, Canada’s oil exports have gained traction in Asia, thanks to the expanded Trans Mountain pipeline and the Westridge Marine Terminal near Vancouver — about 1,600 kilometres south of Prince Rupert, where there is no oil tanker ban.
The Trans Mountain expansion project included the largest expansion of ocean oil spill response in Canadian history, doubling capacity of the West Coast Marine Response Corporation.

The K.J. Gardner is the largest-ever spill response vessel in Canada. Photo courtesy Western Canada Marine Response Corporation
The Canada Energy Regulator (CER) reports that Canadian oil exports to Asia more than tripled after the expanded pipeline and terminal went into service in May 2024.
As a result, the price for Canadian oil has gone up.
The gap between Western Canadian Select (WCS) and West Texas Intermediate (WTI) has narrowed to about $12 per barrel this year, compared to $19 per barrel in 2023, according to GLJ Petroleum Consultants.
Each additional dollar earned per barrel adds about $280 million in annual government royalties and tax revenues, according to economist Peter Tertzakian.
The Road Ahead
There are likely several potential sites for a new West Coast oil terminal, Stevenson said.
“A pipeline is going to find its way to tidewater based upon the safest and most efficient route,” he said.
“The terminal part is relatively straightforward, whether it’s in Prince Rupert or somewhere else.”
Under Canada’s Marine Act, the Port of Prince Rupert’s mandate is to enable trade, Stevenson said.
“If Canada’s trade objectives include moving oil off the West Coast, we’re here to enable it, presuming that the project has a mandate,” he said.
“If we see the basis of a project like this, we would ensure that it’s done to the best possible standard.”

From the Fraser Institute
By Gary Mauser
The government told Cape Bretoners they had two weeks to surrender their firearms to qualify for reimbursement or “buyback.” The pilot project netted a grand total of 22 firearms.
Five years after then-prime minister Justin Trudeau banned more than 100,000 types of so-called “assault-style firearms,” the federal government recently made the first attempt to force Canadians to surrender these firearms.
It didn’t go well.
The police chief in Cape Breton, Nova Scotia, volunteered to run a pilot “buyback” project, which began last month. The government told Cape Bretoners they had two weeks to surrender their firearms to qualify for reimbursement or “buyback.” The pilot project netted a grand total of 22 firearms.
This failure should surprise no one. Back in 2018, a survey of “stakeholders” warned the government that firearms owners wouldn’t support such a gun ban. According to Prime Minister Carney’s own Privy Council Office the “program faces a risk of non-compliance.” And federal Public Safety Minister Gary Anandasangaree was recently recorded admitting that the “buyback” is a partisan maneuver, and if it were up to him, he’d scrap it. What’s surprising is Ottawa’s persistence, particularly given the change in the government and the opportunity to discard ineffective policies.
So what’s really going on here?
One thing is for certain—this program is not, and never has been, about public safety. According to a report from the federal Department of Justice, almost all guns used in crimes in Canada, including in big cities such as Toronto, are possessed illegally by criminals, with many smuggled in from the United States. And according to Ontario’s solicitor general, more than 90 per cent of guns used in crimes in the province are illegally imported from the U.S. Obviously, the “buyback” program will have no effect on these guns possessed illegally by criminals.
Moreover, Canadian firearms owners are exceptionally law-abiding and less likely to commit murder than other Canadians. That also should not be surprising. To own a firearm in Canada, you must obtain a Possession and Acquisition Licence (PAL) from the RCMP after initial vetting and daily monitoring for possible criminal activity. Between 2000 and 2020, an average of 12 PAL-holders per year were accused of homicide, out of approximately two million PAL-holders. During that same 10-year period, the PAL-holder firearms homicide rate was 0.63 (per 100,000 PAL-holders) compared to 0.72 (per 100,000 adult Canadians)—that’s 14 per cent higher than the rate for PAL-holders.
In other words, neither the so-called “assault-style firearms” nor their owners pose a threat to the public.
And the government’s own actions belie its claims. If these firearms are such a threat to Canadians, why slow-roll the “buyback” program? If inaction increased the likelihood of criminality by law-abiding firearms owners, why wait five years before launching a pilot program in a small community such as Cape Breton? And why continue to extend the amnesty period for another year, which the government did last month at the same time its pilot project netted a mere 22 firearms?
To ask those questions is to answer them.
Another question—how much will the “buyback” program cost taxpayers?
The government continues to block any attempt to disclose the full financial costs (although the Canadian Taxpayers Federation has launched a lawsuit to try to force the government to honour its Access to Information Act request). But back in 2020 the Trudeau government said it would cost $200 million to compensate firearms owners (although the Parliamentary Budget Officer said compensation costs could reach $756 million). By 2024, the program had spent $67.2 million—remember, that’s before it collected a single gun. The government recently said the program’s administrative costs (safe storage, destruction of hundreds of thousands of firearms, etc.) would reach an estimated $1.8 billion. And according to Carney’s first budget released in November, his government will spend $364 million on the program this fiscal year—at a time of massive federal deficits and debt.
This is reminiscent of the Chretien government’s gun registry fiasco, which wound up costing more than $2 billion even after then-justice minister Allan Rock promised the registry program would “almost break even” after an $85 million initial cost. The Harper government finally scrapped the registry in 2012.
As the Carney government clings to the policies of its predecessor, Canadians should understand the true nature of Ottawa’s gun “buyback” program and its costs.

Gary Mauser
Professor Emeritus, Simon Fraser University


From Underdog to Top Broodmare

Landmark 2025 Study Says Near-Death Experiences Can’t Be Explained Away

STUDY: TikTok, Instagram, and YouTube Shorts Induce Measurable “Brain Rot”
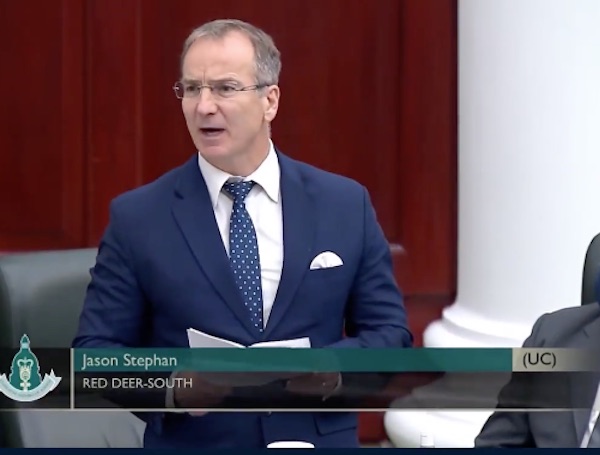
Red Deer’s Jason Stephan calls for citizen-led referendum on late-term abortion ban in Alberta
-
 National1 day ago
Media bound to pay the price for selling their freedom to (selectively) offend
-
 Business1 day ago
Is there a cure for Alzheimer’s Disease?
-
 Bruce Dowbiggin1 day ago
Sometimes An Ingrate Nation Pt. 2: The Great One Makes His Choice
-
 Alberta1 day ago
New era of police accountability
-
 C2C Journal1 day ago
Learning the Truth about “Children’s Graves” and Residential Schools is More Important than Ever
-
 Energy2 days ago
Canadians will soon be versed in massive West Coast LPG mega-project
-
 Artificial Intelligence2 days ago
‘Trouble in Toyland’ report sounds alarm on AI toys
-
 Brownstone Institute1 day ago
The Unmasking of Vaccine Science