Fraser Institute
Here’s your annual bill for public health care


From the Fraser Institute
Notably, the amount paid by the average family has increased by 239.7 per cent since 1997 (the first year of available data).
According to a recent survey by Statistics Canada, almost half of Canadians said that rising prices are affecting their ability to meet day-to-day expenses. At the same time, Canadians are increasingly aware of their significant tax burden, with 74 per cent feeling the average family is overtaxed. This is not surprising given the average Canadian family spends more on taxes than food, clothing and shelter combined.
However, one contributor to this growing tax burden remains hidden—the price we pay public health care. You read that right. Public health care is not free—but it’s very difficult to figure out exactly how much we pay for it on an individual or family basis.
This is primarily because our public health-care system is funded through general government revenues. In other words, there’s no dedicated tax that fully funds the system. Our income taxes, sales taxes, business taxes and other taxes get poured into a fiscal vat, from which governments take a generous portion for health care.
While it’s easy enough to gauge total health-care spending by governments ($225.1 billion) or how much was spent per Canadian ($5,614), it remains nearly impossible for Canadian families of different sizes and incomes to calculate how much they contribute towards that vast amount.

But a recent study helps us get a general idea. According to the study, an average family of four (two parents and two children) with an average income of $176,266 will pay an estimated $17,713 (in taxes) for public health care this year. Single Canadians, with an average income of $55,925, will pay $5,629. Of course, these amounts vary by income with the poorest 10 per cent of income earners paying $639 while the top 10 per cent pay $47,071.
Notably, the amount paid by the average family has increased by 239.7 per cent since 1997 (the first year of available data). This increase is 3.1 times greater than the rate of inflation, 2.2 times greater than food cost increases, and 1.6 times greater than housing costs increases. And crucially, the cost of public health care for the average family has increased 1.7 times faster than their average incomes grew during the same period.
These figures are not only important for families who are interested in how their tax dollars are spent, they are one very important side of the equation when trying to understand whether we receive good value for our health-care dollars. Moreover, as politicians continue to promise ever increasing health-care spending to fix our crumbling system, it’s crucial for Canadians to understand exactly how that spending impacts their wallets.
One thing is clear. With nearly an $18,000 price tag for the average family of four, Canada’s public health-care system is anything but free.
Author:


From the Fraser Institute
By Ben Eisen and Milagros Palacios
Recently, Statistics Canada released a revision of its calculations of Canada’s gross domestic product (GDP) in recent years. GDP measures the total production in an economy in a given year, and per-person GDP is widely accepted by economists as one of the most useful metrics for assessing quality of life. The new estimate places Canada’s GDP for 2024 at 1.4 per cent larger than previously reported.
By the standards of these sorts of revisions—which are usually quite small—the recent update is significant. But make no mistake, the new numbers do not change the fundamental story of Canada’s economic performance, which has been one of historically weak growth and stagnant living standards for an unusually long stretch of time.
Let’s get into the numbers (all adjusted for inflation, in 2017 dollars) with some historical perspective. The new figures put Canada’s per-person GDP estimate for 2024 at $59,529. By comparison, in 2019 per-person GDP was slightly higher at $59,581. This means there has been no progress at all in Canadian living standards as measured by per-person GDP over the past five years. Even with the revision, five years of flat living standards is an extraordinary result.
This is historically anomalous. From 2000 to 2018—a period that was itself not especially strong by the standards of earlier decades—per-person GDP still grew at a compounded annual rate of just under one per cent. In the 1990s, growth was faster still at roughly 1.8 per cent annually. In both periods, living standards were rising meaningfully, even if the pace varied. The fact that they have completely stagnated for five years is alarming, even if our GDP numbers aren’t quite as bleak as we believed a few weeks ago.
Some pundits determined to view all economic data through a political lens have emphasized that under the new revisions, the overall rate of per-person growth during Justin Trudeau’s time as prime minister is now approximately the same as what occurred during Stephen Harper’s tenure.
However, this is more relevant as a political talking point than an economic insight. The historical data show that at an average annual growth rate of just 0.5 per cent, the Canadian economy’s performance under Harper was weak by long-term standards. This is something that Trudeau himself recognized when he first sought high office, criticizing the Harper government for “having the worst record on economic growth since R.B. Bennett in the depths of the Great Depression.”
Trudeau was right back then that Canadian economic growth during the Harper era was historically weak. As such, a revision showing that Canada’s slow growth has approximately continued for the past decade is hardly cause for celebration. It simply underscores that both governments presided over a long period of weak productivity growth and very slow improvements in living standards—and that in recent years even that sluggish growth has given way to complete stagnation.
Of course, an upward revision to recent GDP calculations is welcome news, but it must not be allowed to distract policymakers or the public from the reality of Canada’s severe long-term growth problem, which in recent years has gone from bad to worse.

From the Fraser Institute
By Jake Fuss and Grady Munro
There would have been 1.5 million more Canadians who donated to charity in 2023—and $755.5 million more in donations—had Canadians given to the same extent they did 10 years prior
According to recent polling, approximately one in five Canadians have skipped paying a bill over the past year so they can buy groceries. As families are increasingly hard-pressed to make ends meet, this undoubtedly means more and more people must seek out food banks, shelters and other charitable organizations to meet their basic necessities.
And each year, Canadians across the country donate their time and money to charities to help those in need—particularly around the holiday season. Yet at a time when the relatively high cost of living means these organizations need more resources, new data published by the Fraser Institute shows that the level of charitable giving in Canada is actually falling.
Specifically, over the last 10 years (2013 to 2023, the latest year of available data) the share of tax-filers who reported donating to charity fell from 21.9 per cent to 16.8 per cent. And while fewer Canadians are donating to charity, they’re also donating a smaller share of their income—during the same 10-year period, the share of aggregate income donated to charity fell from 0.55 per cent to 0.52 per cent.
To put this decline into perspective, consider this: there would have been 1.5 million more Canadians who donated to charity in 2023—and $755.5 million more in donations—had Canadians given to the same extent they did 10 years prior. Simply put, this long-standing decline in charitable giving in Canada ultimately limits the resources available for charities to help those in need.
On the bright side, despite the worrying long-term trends, the share of aggregate income donated to charity recently increased from 0.50 per cent in 2022 to 0.52 per cent in 2023. While this may seem like a marginal improvement, 0.02 per cent of aggregate income for all Canadians in 2023 was $255.7 million.
The provinces also reflect the national trends. From 2013 to 2023, every province saw a decline in the share of tax-filers donating to charity. These declines ranged from 15.4 per cent in Quebec to 31.4 per cent in Prince Edward Island.
Similarly, almost every province recorded a drop in the share of aggregate income donated to charity, with the largest being the 24.7 per cent decline seen in P.E.I. The only province to buck this trend was Alberta, which saw a 3.9 per cent increase in the share of aggregate income donated over the decade.
Just as Canada as a whole saw a recent improvement in the share of aggregate income donated, so too did many of the provinces. Indeed, seven provinces (except Manitoba, Nova Scotia and Newfoundland and Labrador) saw an increase in the share of aggregate income donated to charity from 2022 to 2023, with the largest increases occurring in Saskatchewan (7.9 per cent) and Alberta (6.7 per cent).
Canadians also volunteer their time to help those in need, yet the latest data show that volunteerism is also on the wane. According to Statistics Canada, the share of Canadians who volunteered (both formally and informally) fell by 8 per cent from 2018 to 2023. And the total numbers of hours volunteered (again, both formal and informal) fell by 18 per cent over that same period.
With many Canadians struggling to make ends meet, food banks, shelters and other charitable organizations play a critical role in providing basic necessities to those in need. Yet charitable giving—which provides resources for these charities—has long been on the decline. Hopefully, we’ll see this trend turn around swiftly.


Trump DOJ seeks to quash Pfizer whistleblower’s lawsuit over COVID shots

Alberta introducing three “all-season resort areas” to provide more summer activities in Alberta’s mountain parks
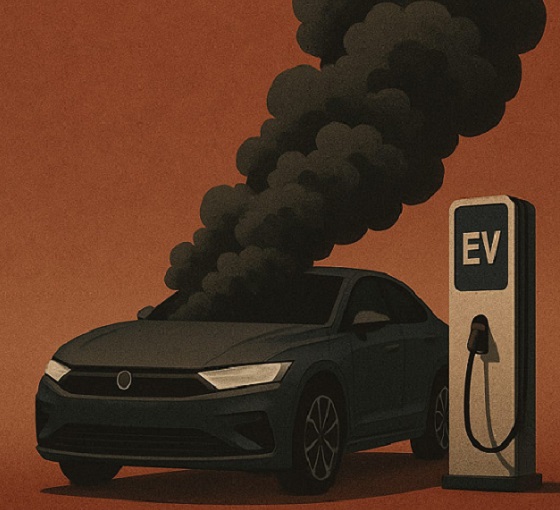
The $50 Billion Question: EVs Never Delivered What Ottawa Promised

Trump admin wants to help Canadian woman rethink euthanasia, Glenn Beck says
-
 Alberta2 days ago
Alberta’s huge oil sands reserves dwarf U.S. shale
-
 Indigenous2 days ago
Residential school burials controversy continues to fuel wave of church arsons, new data suggests
-
 Health2 days ago
Saskatchewan woman approved for euthanasia urged to seek medical help in Canada rather than US
-
 Health2 days ago
Canadian gov’t considers sharing census data on gender-confused children
-
 International2 days ago
FBI didn’t think it had cause to raid Trump but DOJ did it anyway
-
 Daily Caller2 days ago
Paris Climate Deal Now Decade-Old Disaster
-
 Business1 day ago
Ottawa Pretends To Pivot But Keeps Spending Like Trudeau
-
 International1 day ago
Bondi Beach Shows Why Self-Defense Is a Vital Right