Canadian Energy Centre
Canadian energy producers among worlds’ best at limiting gas flaring
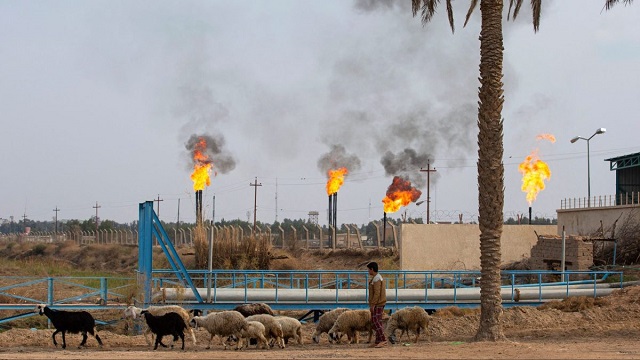
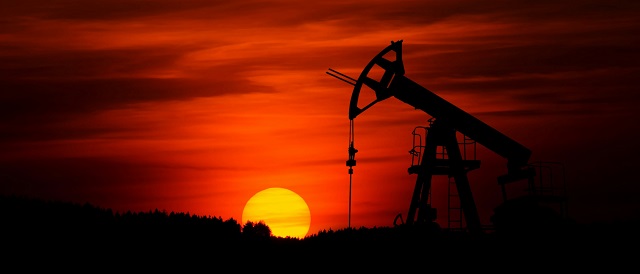
The Nahr Bin Omar oil field and facility near Iraq’s southern port city of Basra on February 11, 2022. In the oilfields of southern Iraq, billions of cubic feet of gas literally go up in smoke, burnt off on flare stacks for want of the infrastructure to capture and process it. (Photo by HUSSEIN FALEH/AFP via Getty Images)
From the Canadian Energy Centre
International comparisons of gas flaring among top oil producers
Canada contributed just 0.7% of the global amount of gas flaring despite being the world’s fourth-largest oil producer
By Ven Venkatachalam and Lennie Kaplan
This Fact Sheet analyzes the upstream oil industry’s record on flaring in Canada relative to other top oil-producing countries. Gas flaring is the burning off of the natural gas that is generated in the process of oil extraction and production. Flaring is relevant because it is a source of greenhouse gas emissions (GHGs) (see Appendix).
In 2022, 138,549 million cubic meters (m3) (or 139 billion cubic meters (bcm)) of flared gases were emitted worldwide, creating 350 million tonnes of CO2 emissions annually. Canada is a significant oil producer; it has the third-largest proven crude oil reserves and is the fourthlargest crude oil producer in the world (Natural Resources Canada, undated), and so contributes to flaring.
Flaring comparisons
This Fact Sheet uses World Bank data to provide international comparisons of flaring. It also draws on U.S. Energy Information Administration (EIA) crude oil production data to compare flaring among the top 10 crude oil producing countries.
Table 1 shows gas flaring volumes in 2012 and 2022. In absolute terms, Russia recorded more flaring than any other country at 25,495 million m3 (25.4 bcm) in 2022, which was 1,628 million m3 (7 per cent) higher than in 2012.
The four countries that are the top GHG emitters through flaring (Russia, Iraq, Iran, and Algeria) accounted for 50 per cent of global gas flaring in 2022.
At 945 million m3, Canada was the eighth lowest flarer in 2022 (23rd spot out of the top 30 countries). It decreased its flaring emissions by 320 million m3 from the 2012 level of 1,264 million m3, a 25 per cent drop.
In 2022, Canada contributed just 0.7 per cent of the global amount of gas flaring despite being the world’s fourth largest oil producer (see Table 1).

Sources: World Bank (undated)
Flaring declined worldwide between 2012 and 2022
Figure 1 shows the change in flaring volumes between 2012 and 2022. Nine countries flared more in 2022 than in 2012, while 21 countries flared less. In the last decade, the global flaring volume decreased by 3 per cent.
- The three countries that most significantly increased flaring between 2012 and 2022 were the Republic of the Congo (65 per cent), Iran (56 per cent), and Iraq (41 per cent).
- The three countries that most significantly decreased flaring between 2012 and 2022 were Uzbekistan (-76 per cent), Columbia (-75 per cent) and Kazakhstan (-74 per cent).
- As noted earlier, flaring fell by 25 per cent in Canada between 2012 and 2022.

Sources: World Bank (undated)
Comparing flaring to increased production
The decreases in flaring in Canada between 2012 and 2022 shown in Table 1 and Figure 1 understate the magnitude of the decline in flaring in the country. That is because Canada’s crude oil production increased by 45 per cent in that period, even as absolute flaring decreased by 25 per cent (see Table 2).
Canada compares very favourably with the United States, which increased crude oil production by 82 per cent and decreased flaring by 16 per cent.

Sources: World Bank (undated) and EIA (2023)
Largest oil producers and flaring intensity
To fully grasp how much more effective Canada has been than many other oil producers in reducing flaring, Table 3 compares both flaring intensity (gas flared per unit of oil production) and crude oil production among the top 10 oil producing countries (which account for 73 per cent of the world oil production).
Canada is the fourth-largest producer of crude oil, and its gas flaring intensity declined by 48 per cenft between 2012 and 2022. Four of the top 10 oil producers witnessed their flaring intensity increase between 2012 and 2022.

Sources: World Bank (undated) and EIA (2023)
Conclusion
Gas flaring contributes to greenhouse gas emissions. However, it is possible for countries to both increase their oil production and still reduce flaring. Canada is one noteworthy example of a country that has significantly reduced flaring not only compared to its increased production of crude oil, but also in absolute terms.
Appendix
Background
Flaring and venting are two ways in which an oil or natural gas producer can dispose of waste gases. Venting is the intentional controlled release of uncombusted gases directly to the atmosphere, and flaring is combusting natural gas or gas derived from petroleum in order to dispose of it.¹ As Matthew R. Johnson and Adam R. Coderre noted in their 2012 paper on the subject, flaring in the petroleum industry generally falls within three broad categories:
- Emergency flaring (large, unplanned, and very short-duration releases, typically at larger downstream facilities or off-shore platforms);
- Process flaring (intermittent large or small releases that may last for a few hours or a few days as occurs in the upstream industry during well-test flaring to assess the size of a reservoir or at a downstream plant during a planned process blowdown); and
- Production flaring (may occur continuously for years while oil is being produced).
To track GHGs from flaring and venting, Environment Canada (2016) defines such emissions as:
- Fugitive emissions: Unintentional releases from venting, flaring, or leakage of gases from fossil fuel production and processing, iron and steel coke oven batteries, or CO2 capture, transport, injection, and storage infrastructure.
- Flaring emissions: Controlled releases of gases from industrial activities from the combustion of a gas or liquid stream produced at a facility, the purpose of which is not to produce useful heat or work. This includes releases from waste petroleum incineration, hazardous emission prevention systems, well testing, natural gas gathering systems, natural gas processing plant operations, crude oil production, pipeline operations, petroleum refining, chemical fertilizer production, and steel production.
- Venting emissions: Controlled releases of a process or waste gas, including releases of CO2 associated with carbon capture, transport, injection, and storage; from hydrogen production associated with fossil fuel production and processing; of casing gas; of gases associated with a liquid or a solution gas; of treater, stabilizer, or dehydrator off-gas; of blanket gases; from pneumatic devices that use natural gas as a driver; from compressor start-ups, pipelines, and other blowdowns; and from metering and regulation station control loops.
1. Many provinces regulate flaring and venting including Alberta (Directive 060) British Columbia (Flaring and Venting Reduction Guideline), and Saskatchewan (S-10 and S-20). Newfoundland & Labrador also has regulations that govern offshore flaring.
Notes
This CEC Fact Sheet was compiled by Ven Venkatachalam and Lennie Kaplan at the Canadian Energy Centre: www.canadianenergycentre.ca. All percentages in this report are calculated from the original data, which can run to multiple decimal points. They are not calculated using the rounded figures that may appear in charts and in the text, which are more reader friendly. Thus, calculations made from the rounded figures (and not the more precise source data) will differ from the more statistically precise percentages we arrive at using source data. The authors and the Canadian Energy Centre would like to thank and acknowledge the assistance of an anonymous reviewer in reviewing the data and research for this Fact Sheet.
References (All links live as of September 23, 2023)
Alberta Energy Regulator (2022), Directive 060: Upstream Petroleum Industry Faring, Incinerating, and Venting <https://bit.ly/3AMYett>; BC Oil and Gas Commission (2021), Flaring and Venting Reduction Guideline, version 5.2 <https://bit.ly/3CWRa0i>; Canada-Newfoundland and Labrador Offshore Petroleum Board (2007), Offshore Newfoundland and Labrador Gas Flaring Reduction <https://bit.ly/3RhKpKu>; D&I Services (2010), Saskatchewan Energy and Resources: S-10 and S-20 <https://bit.ly/3TBrVGJ>; Johnson, Matthew R., and Adam R. Coderre (2012), Compositions and Greenhouse Gas Emission Factors of Flared and Vented Gas in the Western Canadian Sedimentary Basin, Journal of the Air & Waste Management Association 62, 9: 992-1002 <https://bit.ly/3cJRqPd>; Environment Canada (2016), Technical Guidance on Reporting Greenhouse Gas Emissions/Facility Greenhouse Gas Emissions Reporting Program <https://bit.ly/3CVQR5C>; Natural Resources Canada (Undated), Oil Resources <https://bit.ly/3oWWhW0>; U.S. Energy Information Administration (undated), Petroleum and Other Liquids <https://bit.ly/2Ad6S9i>; World Bank (Undated), Global Gas Flaring Data <https://bit.ly/3zXuxGX>.
Canadian Energy Centre
Trans Mountain completion shows victory of good faith Indigenous consultation
Photo courtesy Trans Mountain Corporation
From the Canadian Energy Centre
‘Now that the Trans Mountain expansion is finally completed, it will provide trans-generational benefits to First Nations involved’
While many are celebrating the completion of the Trans Mountain pipeline expansion project for its benefit of delivering better prices for Canadian energy to international markets, it’s important to reflect on how the project demonstrates successful economic reconciliation with Indigenous communities.
It’s easy to forget how we got here.
The history of Trans Mountain has been fraught with obstacles and delays that could have killed the project, but it survived. This stands in contrast to other pipelines such as Energy East and Keystone XL.
Starting in 2012, proponent Kinder Morgan Canada engaged in consultation with multiple parties – including many First Nation and Métis communities – on potential project impacts.
According to Trans Mountain, there have been 73,000 points of contact with Indigenous communities throughout Alberta and British Columbia as the expansion was developed and constructed. The new federal government owners of the pipeline committed to ongoing consultation during early construction and operations phase.
Beyond formal Indigenous engagement, the project proponent conducted numerous environmental and engineering field studies. These included studies drawing on deep Indigenous input, such as traditional ecological knowledge studies, traditional land use studies, and traditional marine land use studies.
At each stage of consultation, the proponent had to take into consideration this input, and if necessary – which occurred regularly – adjust the pipeline route or change an approach.
With such a large undertaking, Kinder Morgan and later Trans Mountain Corporation as a government entity had to maintain relationships with many Indigenous parties and make sure they got it right.
 Trans Mountain participates in a cultural ceremony with the Shxw’ōwhámél First Nation near Hope, B.C. Photograph courtesy Trans Mountain
It was the opposite of the superficial “checklist” form of consultation that companies had long been criticized for.
While most of the First Nation and Métis communities engaged in good faith with Kinder Morgan, and later the federal government, and wanted to maximize environmental protections and ensure they got the best deal for their communities, environmentalist opponents wanted to kill the project outright from the start.
After the government took over the incomplete expansion in 2018, green activists were transparent about using cost overruns as a tactic to scuttle and defeat the project. They tried to make Trans Mountain ground zero for their anti-energy divestment crusade, targeting investors.
It is an amazing testament to importance of Trans Mountain that it survived this bad faith onslaught.
In true eco-colonialist fashion, the non-Indigenous activist community did not care that the consultation process for Trans Mountain project was achieving economic reconciliation in front of their eyes. They were “fair weather friends” who supported Indigenous communities only when they opposed energy projects.
They missed the broad support for the Trans Mountain expansion. As of March 2023, the project had signed agreements with 81 Indigenous communities along the proposed route worth $657 million, and the project has created over $4.8 billion in contracts with Indigenous businesses.
Most importantly, Trans Mountain saw the maturing of Indigenous capital as Indigenous coalitions came together to seek equity stakes in the pipeline. Project Reconciliation, the Alberta-based Iron Coalition and B.C.’s Western Indigenous Pipeline Group all presented detailed proposals to assume ownership.
Although these equity proposals have not yet resulted in a sale agreement, they involved taking that important first step. Trans Mountain showed what was possible for Indigenous ownership, and now with more growth and perhaps legislative help from provincial and federal governments, an Indigenous consortium will be eventually successful when the government looks to sell the project.
If an Indigenous partner ultimately acquires an equity stake in Trans Mountain, observers close to the negotiations are convinced it will be a sizeable stake, well beyond 10 per cent. It will be a transformative venture for many First Nations involved.
Now that the Trans Mountain expansion is finally completed, it will provide trans-generational benefits to First Nations involved, including lasting work for Indigenous companies. It will also demonstrate the victory of good faith Indigenous consultation over bad faith opposition.
Alberta
Game changer: Trans Mountain pipeline expansion complete and starting to flow Canada’s oil to the world
Workers complete the “golden weld” of the Trans Mountain pipeline expansion on April 11, 2024 in the Fraser Valley between Hope and Chilliwack, B.C. The project saw mechanical completion on April 30, 2024. Photo courtesy Trans Mountain Corporation
From the Canadian Energy Centre
By Will Gibson
‘We’re going to be moving into a market where buyers are going to be competing to buy Canadian oil’
It is a game changer for Canada that will have ripple effects around the world.
The Trans Mountain pipeline expansion is now complete. And for the first time, global customers can access large volumes of Canadian oil, with the benefits flowing to Canada’s economy and Indigenous communities.
“We’re going to be moving into a market where buyers are going to be competing to buy Canadian oil,” BMO Capital Markets director Randy Ollenberger said recently, adding this is expected to result in a better price for Canadian oil relative to other global benchmarks.
The long-awaited expansion nearly triples capacity on the Trans Mountain system from Edmonton to the West Coast to approximately 890,000 barrels per day. Customers for the first shipments include refiners in China, California and India, according to media reports.
Shippers include all six members of the Pathways Alliance, a group of companies representing 95 per cent of oil sands production that together plan to reduce emissions from operations by 22 megatonnes by 2030 on the way to net zero by 2050.
The first tanker shipment from Trans Mountain’s expanded Westridge Marine Terminal is expected later in May.
 Photo courtesy Trans Mountain Corporation
The new capacity on the Trans Mountain system comes as demand for Canadian oil from markets outside the United States is on the rise.
According to the Canada Energy Regulator, exports to destinations beyond the U.S. have averaged a record 267,000 barrels per day so far this year, up from about 130,000 barrels per day in 2020 and 33,000 barrels per day in 2017.
“Oil demand globally continues to go up,” said Phil Skolnick, New York-based oil market analyst with Eight Capital.
“Both India and China are looking to add millions of barrels a day of refining capacity through 2030.”
In India, refining demand will increase mainly for so-called medium and heavy oil like what is produced in Canada, he said.
“That’s where TMX is the opportunity for Canada, because that’s the route to get to India.”
Led by India and China, oil demand in the Asia-Pacific region is projected to increase from 36 million barrels per day in 2022 to 52 million barrels per day in 2050, according to the U.S. Energy Information Administration.
More oil coming from Canada will shake up markets for similar world oil streams including from Russia, Ecuador, and Iraq, according to analysts with Rystad Energy and Argus Media.
Expanded exports are expected to improve pricing for Canadian heavy oil, which “have been depressed for many years” in part due to pipeline shortages, according to TD Economics.
 Photo courtesy Trans Mountain Corporation
In recent years, the price for oil benchmark Western Canadian Select (WCS) has hovered between $18-$20 lower than West Texas Intermediate (WTI) “to reflect these hurdles,” analyst Marc Ercolao wrote in March.
“That spread should narrow as a result of the Trans Mountain completion,” he wrote.
“Looking forward, WCS prices could conservatively close the spread by $3–4/barrel later this year, which will incentivize production and support industry profitability.”
Canada’s Parliamentary Budget Office has said that an increase of US$5 per barrel for Canadian heavy oil would add $6 billion to Canada’s economy over the course of one year.
The Trans Mountain Expansion will leave a lasting economic legacy, according to an impact assessment conducted by Ernst & Young in March 2023.
In addition to $4.9 billion in contracts with Indigenous businesses during construction, the project leaves behind more than $650 million in benefit agreements and $1.2 billion in skills training with Indigenous communities.
Ernst & Young found that between 2024 and 2043, the expanded Trans Mountain system will pay $3.7 billion in wages, generate $9.2 billion in GDP, and pay $2.8 billion in government taxes.


Medical Elites’ Disgrace Over Ivermectin

Electric vehicle mandates mean misery all around
Getting Real About Justin’s Real Estate Economy. It Won’t Last
‘It Makes No Sense’: Experts Puzzled By Biden Admin’s Claim That Rafah Invasion Wouldn’t Help Israel Defeat Hamas
Kenyan doctor: WHO pandemic treaty aims to ‘maim and kill’ and ‘establish a one-world government’

The New York Times Admits Injuries from COVID-19 Shots

Why Do The Same Few Always Get The Best Sports Scoops?

-
 Energy10 hours ago
Tech giants’ self-made AI energy crisis
-
 Energy1 day ago
New Report Reveals Just How Energy Rich America Really Is
-
 Automotive1 day ago
Biden’s Climate Agenda Is Running Headfirst Into A Wall Of His Own Making
-
 Economy1 day ago
Feds spend $3 million to fly 182 politicians and bureaucrats to climate conference
-
 Addictions18 hours ago
Liberals shut down motion to disclose pharma payments for Trudeau’s ‘safe supply’ drug program
-
 espionage13 hours ago
The Scientists Who Came in From the Cold: Canada’s National Microbiology Laboratory Scandal, Part I
-
 Frontier Centre for Public Policy7 hours ago
The PM as Leaf’s coach
-
 Opinion1 day ago
Ordinary working Canadians are not buying into transgender identity politics