Canadian Energy Centre
Canadian energy producers among worlds’ best at limiting gas flaring
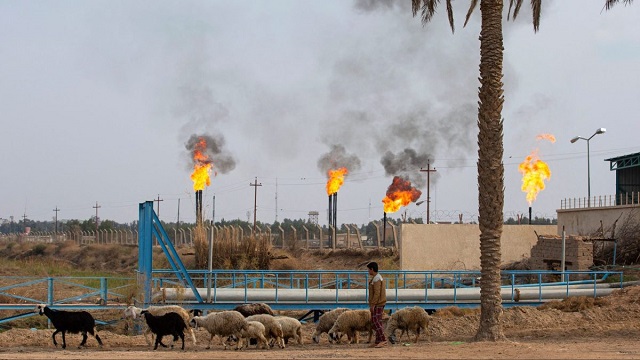
The Nahr Bin Omar oil field and facility near Iraq’s southern port city of Basra on February 11, 2022. In the oilfields of southern Iraq, billions of cubic feet of gas literally go up in smoke, burnt off on flare stacks for want of the infrastructure to capture and process it. (Photo by HUSSEIN FALEH/AFP via Getty Images)
From the Canadian Energy Centre
International comparisons of gas flaring among top oil producers
Canada contributed just 0.7% of the global amount of gas flaring despite being the world’s fourth-largest oil producer
By Ven Venkatachalam and Lennie Kaplan
This Fact Sheet analyzes the upstream oil industry’s record on flaring in Canada relative to other top oil-producing countries. Gas flaring is the burning off of the natural gas that is generated in the process of oil extraction and production. Flaring is relevant because it is a source of greenhouse gas emissions (GHGs) (see Appendix).
In 2022, 138,549 million cubic meters (m3) (or 139 billion cubic meters (bcm)) of flared gases were emitted worldwide, creating 350 million tonnes of CO2 emissions annually. Canada is a significant oil producer; it has the third-largest proven crude oil reserves and is the fourthlargest crude oil producer in the world (Natural Resources Canada, undated), and so contributes to flaring.
Flaring comparisons
This Fact Sheet uses World Bank data to provide international comparisons of flaring. It also draws on U.S. Energy Information Administration (EIA) crude oil production data to compare flaring among the top 10 crude oil producing countries.
Table 1 shows gas flaring volumes in 2012 and 2022. In absolute terms, Russia recorded more flaring than any other country at 25,495 million m3 (25.4 bcm) in 2022, which was 1,628 million m3 (7 per cent) higher than in 2012.
The four countries that are the top GHG emitters through flaring (Russia, Iraq, Iran, and Algeria) accounted for 50 per cent of global gas flaring in 2022.
At 945 million m3, Canada was the eighth lowest flarer in 2022 (23rd spot out of the top 30 countries). It decreased its flaring emissions by 320 million m3 from the 2012 level of 1,264 million m3, a 25 per cent drop.
In 2022, Canada contributed just 0.7 per cent of the global amount of gas flaring despite being the world’s fourth largest oil producer (see Table 1).

Sources: World Bank (undated)
Flaring declined worldwide between 2012 and 2022
Figure 1 shows the change in flaring volumes between 2012 and 2022. Nine countries flared more in 2022 than in 2012, while 21 countries flared less. In the last decade, the global flaring volume decreased by 3 per cent.
- The three countries that most significantly increased flaring between 2012 and 2022 were the Republic of the Congo (65 per cent), Iran (56 per cent), and Iraq (41 per cent).
- The three countries that most significantly decreased flaring between 2012 and 2022 were Uzbekistan (-76 per cent), Columbia (-75 per cent) and Kazakhstan (-74 per cent).
- As noted earlier, flaring fell by 25 per cent in Canada between 2012 and 2022.

Sources: World Bank (undated)
Comparing flaring to increased production
The decreases in flaring in Canada between 2012 and 2022 shown in Table 1 and Figure 1 understate the magnitude of the decline in flaring in the country. That is because Canada’s crude oil production increased by 45 per cent in that period, even as absolute flaring decreased by 25 per cent (see Table 2).
Canada compares very favourably with the United States, which increased crude oil production by 82 per cent and decreased flaring by 16 per cent.

Sources: World Bank (undated) and EIA (2023)
Largest oil producers and flaring intensity
To fully grasp how much more effective Canada has been than many other oil producers in reducing flaring, Table 3 compares both flaring intensity (gas flared per unit of oil production) and crude oil production among the top 10 oil producing countries (which account for 73 per cent of the world oil production).
Canada is the fourth-largest producer of crude oil, and its gas flaring intensity declined by 48 per cenft between 2012 and 2022. Four of the top 10 oil producers witnessed their flaring intensity increase between 2012 and 2022.

Sources: World Bank (undated) and EIA (2023)
Conclusion
Gas flaring contributes to greenhouse gas emissions. However, it is possible for countries to both increase their oil production and still reduce flaring. Canada is one noteworthy example of a country that has significantly reduced flaring not only compared to its increased production of crude oil, but also in absolute terms.
Appendix
Background
Flaring and venting are two ways in which an oil or natural gas producer can dispose of waste gases. Venting is the intentional controlled release of uncombusted gases directly to the atmosphere, and flaring is combusting natural gas or gas derived from petroleum in order to dispose of it.¹ As Matthew R. Johnson and Adam R. Coderre noted in their 2012 paper on the subject, flaring in the petroleum industry generally falls within three broad categories:
- Emergency flaring (large, unplanned, and very short-duration releases, typically at larger downstream facilities or off-shore platforms);
- Process flaring (intermittent large or small releases that may last for a few hours or a few days as occurs in the upstream industry during well-test flaring to assess the size of a reservoir or at a downstream plant during a planned process blowdown); and
- Production flaring (may occur continuously for years while oil is being produced).
To track GHGs from flaring and venting, Environment Canada (2016) defines such emissions as:
- Fugitive emissions: Unintentional releases from venting, flaring, or leakage of gases from fossil fuel production and processing, iron and steel coke oven batteries, or CO2 capture, transport, injection, and storage infrastructure.
- Flaring emissions: Controlled releases of gases from industrial activities from the combustion of a gas or liquid stream produced at a facility, the purpose of which is not to produce useful heat or work. This includes releases from waste petroleum incineration, hazardous emission prevention systems, well testing, natural gas gathering systems, natural gas processing plant operations, crude oil production, pipeline operations, petroleum refining, chemical fertilizer production, and steel production.
- Venting emissions: Controlled releases of a process or waste gas, including releases of CO2 associated with carbon capture, transport, injection, and storage; from hydrogen production associated with fossil fuel production and processing; of casing gas; of gases associated with a liquid or a solution gas; of treater, stabilizer, or dehydrator off-gas; of blanket gases; from pneumatic devices that use natural gas as a driver; from compressor start-ups, pipelines, and other blowdowns; and from metering and regulation station control loops.
1. Many provinces regulate flaring and venting including Alberta (Directive 060) British Columbia (Flaring and Venting Reduction Guideline), and Saskatchewan (S-10 and S-20). Newfoundland & Labrador also has regulations that govern offshore flaring.
Notes
This CEC Fact Sheet was compiled by Ven Venkatachalam and Lennie Kaplan at the Canadian Energy Centre: www.canadianenergycentre.ca. All percentages in this report are calculated from the original data, which can run to multiple decimal points. They are not calculated using the rounded figures that may appear in charts and in the text, which are more reader friendly. Thus, calculations made from the rounded figures (and not the more precise source data) will differ from the more statistically precise percentages we arrive at using source data. The authors and the Canadian Energy Centre would like to thank and acknowledge the assistance of an anonymous reviewer in reviewing the data and research for this Fact Sheet.
References (All links live as of September 23, 2023)
Alberta Energy Regulator (2022), Directive 060: Upstream Petroleum Industry Faring, Incinerating, and Venting <https://bit.ly/3AMYett>; BC Oil and Gas Commission (2021), Flaring and Venting Reduction Guideline, version 5.2 <https://bit.ly/3CWRa0i>; Canada-Newfoundland and Labrador Offshore Petroleum Board (2007), Offshore Newfoundland and Labrador Gas Flaring Reduction <https://bit.ly/3RhKpKu>; D&I Services (2010), Saskatchewan Energy and Resources: S-10 and S-20 <https://bit.ly/3TBrVGJ>; Johnson, Matthew R., and Adam R. Coderre (2012), Compositions and Greenhouse Gas Emission Factors of Flared and Vented Gas in the Western Canadian Sedimentary Basin, Journal of the Air & Waste Management Association 62, 9: 992-1002 <https://bit.ly/3cJRqPd>; Environment Canada (2016), Technical Guidance on Reporting Greenhouse Gas Emissions/Facility Greenhouse Gas Emissions Reporting Program <https://bit.ly/3CVQR5C>; Natural Resources Canada (Undated), Oil Resources <https://bit.ly/3oWWhW0>; U.S. Energy Information Administration (undated), Petroleum and Other Liquids <https://bit.ly/2Ad6S9i>; World Bank (Undated), Global Gas Flaring Data <https://bit.ly/3zXuxGX>.
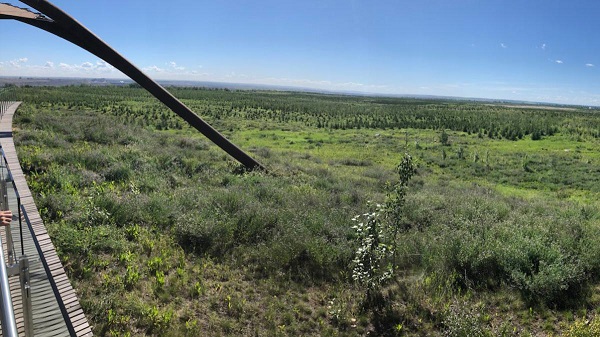
Wapisiw Lookout, reclaimed site of the oil sands industry’s first tailings pond, which started in 1967. The area was restored to a solid surface in 2010 and now functions as a 220-acre watershed. Photo courtesy Suncor Energy
From the Canadian Energy Centre
By CEC Research
Mines demonstrate significant strides through technological innovation
Tailings are a byproduct of mining operations around the world.
In Alberta’s oil sands, tailings are a fluid mixture of water, sand, silt, clay and residual bitumen generated during the extraction process.
Engineered basins or “tailings ponds” store the material and help oil sands mining projects recycle water, reducing the amount withdrawn from the Athabasca River.
In 2023, 79 per cent of the water used for oil sands mining was recycled, according to the latest data from the Alberta Energy Regulator (AER).
Decades of operations, rising production and federal regulations prohibiting the release of process-affected water have contributed to a significant accumulation of oil sands fluid tailings.
The Mining Association of Canada describes that:
“Like many other industrial processes, the oil sands mining process requires water.
However, while many other types of mines in Canada like copper, nickel, gold, iron ore and diamond mines are allowed to release water (effluent) to an aquatic environment provided that it meets stringent regulatory requirements, there are no such regulations for oil sands mines.
Instead, these mines have had to retain most of the water used in their processes, and significant amounts of accumulated precipitation, since the mines began operating.”
Despite this ongoing challenge, oil sands mining operators have made significant strides in reducing fluid tailings through technological innovation.
This is demonstrated by reductions in “legacy fluid tailings” since 2015.
Legacy Fluid Tailings vs. New Fluid Tailings
As part of implementing the Tailings Management Framework introduced in March 2015, the AER released Directive 085: Fluid Tailings Management for Oil Sands Mining Projects in July 2016.
Directive 085 introduced new criteria for the measurement and closure of “legacy fluid tailings” separate from those applied to “new fluid tailings.”
Legacy fluid tailings are defined as those deposited in storage before January 1, 2015, while new fluid tailings are those deposited in storage after January 1, 2015.
The new rules specified that new fluid tailings must be ready to reclaim ten years after the end of a mine’s life, while legacy fluid tailings must be ready to reclaim by the end of a mine’s life.
Total Oil Sands Legacy Fluid Tailings

Alberta’s oil sands mining sector decreased total legacy fluid tailings by approximately 40 per cent between 2015 and 2024, according to the latest company reporting to the AER.
Total legacy fluid tailings in 2024 were approximately 623 million cubic metres, down from about one billion cubic metres in 2015.
The reductions are led by the sector’s longest-running projects: Suncor Energy’s Base Mine (opened in 1967), Syncrude’s Mildred Lake Mine (opened in 1978), and Syncrude’s Aurora North Mine (opened in 2001). All are now operated by Suncor Energy.
The Horizon Mine, operated by Canadian Natural Resources (opened in 2009) also reports a significant reduction in legacy fluid tailings.
The Muskeg River Mine (opened in 2002) and Jackpine Mine (opened in 2010) had modest changes in legacy fluid tailings over the period. Both are now operated by Canadian Natural Resources.
Imperial Oil’s Kearl Mine (opened in 2013) and Suncor Energy’s Fort Hills Mine (opened in 2018) have no reported legacy fluid tailings.
Suncor Energy Base Mine

Between 2015 and 2024, Suncor Energy’s Base Mine reduced legacy fluid tailings by approximately 98 per cent, from 293 million cubic metres to 6 million cubic metres.
Syncrude Mildred Lake Mine

Between 2015 and 2024, Syncrude’s Mildred Lake Mine reduced legacy fluid tailings by approximately 15 per cent, from 457 million cubic metres to 389 million cubic metres.
Syncrude Aurora North Mine

Between 2015 and 2024, Syncrude’s Aurora North Mine reduced legacy fluid tailings by approximately 25 per cent, from 102 million cubic metres to 77 million cubic metres.
Canadian Natural Resources Horizon Mine

Between 2015 and 2024, Canadian Natural Resources’ Horizon Mine reduced legacy fluid tailings by approximately 36 per cent, from 66 million cubic metres to 42 million cubic metres.
Total Oil Sands Fluid Tailings
Reducing legacy fluid tailings has helped slow the overall growth of fluid tailings across the oil sands sector.
Without efforts to reduce legacy fluid tailings, the total oil sands fluid tailings footprint today would be approximately 1.6 billion cubic metres.
The current fluid tailings volume stands at approximately 1.2 billion cubic metres, up from roughly 1.1 billion in 2015.

The unaltered reproduction of this content is free of charge with attribution to the Canadian Energy Centre.
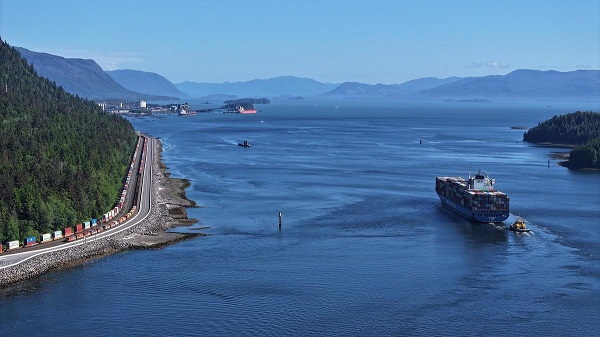
The Port of Prince Rupert on the north coast of British Columbia. Photo courtesy Prince Rupert Port Authority
From the Canadian Energy Centre
By Will Gibson
Moratorium does little to improve marine safety while sending the wrong message to energy investors
In 2019, Martha Hall Findlay, then-CEO of the Canada West Foundation, penned a strongly worded op-ed in the Globe and Mail calling the federal ban of oil tankers on B.C.’s northern coast “un-Canadian.”
Six years later, her opinion hasn’t changed.
“It was bad legislation and the government should get rid of it,” said Hall Findlay, now director of the University of Calgary’s School of Public Policy.
The moratorium, known as Bill C-48, banned vessels carrying more than 12,500 tonnes of oil from accessing northern B.C. ports.
Targeting products from one sector in one area does little to achieve the goal of overall improved marine transport safety, she said.
“There are risks associated with any kind of transportation with any goods, and not all of them are with oil tankers. All that singling out one part of one coast did was prevent more oil and gas from being produced that could be shipped off that coast,” she said.
Hall Findlay is a former Liberal MP who served as Suncor Energy’s chief sustainability officer before taking on her role at the University of Calgary.
She sees an opportunity to remove the tanker moratorium in light of changing attitudes about resource development across Canada and a new federal government that has publicly committed to delivering nation-building energy projects.
“There’s a greater recognition in large portions of the public across the country, not just Alberta and Saskatchewan, that Canada is too dependent on the United States as the only customer for our energy products,” she said.
“There are better alternatives to C-48, such as setting aside what are called Particularly Sensitive Sea Areas, which have been established in areas such as the Great Barrier Reef and the Galapagos Islands.”
The Business Council of British Columbia, which represents more than 200 companies, post-secondary institutions and industry associations, echoes Hall Findlay’s call for the tanker ban to be repealed.
“Comparable shipments face no such restrictions on the East Coast,” said Denise Mullen, the council’s director of environment, sustainability and Indigenous relations.
“This unfair treatment reinforces Canada’s over-reliance on the U.S. market, where Canadian oil is sold at a discount, by restricting access to Asia-Pacific markets.
“This results in billions in lost government revenues and reduced private investment at a time when our economy can least afford it.”
The ban on tanker traffic specifically in northern B.C. doesn’t make sense given Canada already has strong marine safety regulations in place, Mullen said.
Notably, completion of the Trans Mountain Pipeline expansion in 2024 also doubled marine spill response capacity on Canada’s West Coast. A $170 million investment added new equipment, personnel and response bases in the Salish Sea.
“The [C-48] moratorium adds little real protection while sending a damaging message to global investors,” she said.
“This undermines the confidence needed for long-term investment in critical trade-enabling infrastructure.”
Indigenous Resource Network executive director John Desjarlais senses there’s an openness to revisiting the issue for Indigenous communities.
“Sentiment has changed and evolved in the past six years,” he said.
“There are still concerns and trust that needs to be built. But there’s also a recognition that in addition to environmental impacts, [there are] consequences of not doing it in terms of an economic impact as well as the cascading socio-economic impacts.”
The ban effectively killed the proposed $16-billion Eagle Spirit project, an Indigenous-led pipeline that would have shipped oil from northern Alberta to a tidewater export terminal at Prince Rupert, B.C.
“When you have Indigenous participants who want to advance these projects, the moratorium needs to be revisited,” Desjarlais said.
He notes that in the six years since the tanker ban went into effect, there are growing partnerships between B.C. First Nations and the energy industry, including the Haisla Nation’s Cedar LNG project and the Nisga’a Nation’s Ksi Lisims LNG project.
This has deepened the trust that projects can mitigate risks while providing economic reconciliation and benefits to communities, Dejarlais said.
“Industry has come leaps and bounds in terms of working with First Nations,” he said.
“They are treating the rights of the communities they work with appropriately in terms of project risk and returns.”
Hall Findlay is cautiously optimistic that the tanker ban will be replaced by more appropriate legislation.
“I’m hoping that we see the revival of a federal government that brings pragmatism to governing the country,” she said.
“Repealing C-48 would be a sign of that happening.”
Canada’s Carbon Tax Is A Disaster For Our Economy And Oil Industry

Trump’s One Big Beautiful Bill Resets The Energy Policy Playing Field
Texas flood kills 43 including children at Christian camp

The Digital Services Tax Q&A: “It was going to be complicated and messy”

Elon Musk forms America Party after split with Trump

Alberta Next: Immigration

FDA requires new warning on mRNA COVID shots due to heart damage in young men
-
 Alberta2 days ago
Alberta school boards required to meet new standards for school library materials with regard to sexual content
-
 Environment2 days ago
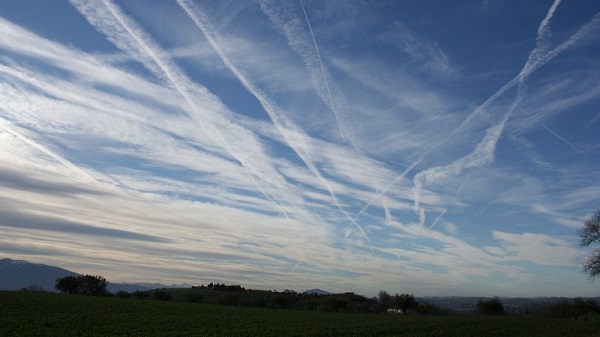
EPA releases report on chemtrails, climate manipulation
-
 Business2 days ago
UN’s ‘Plastics Treaty’ Sports A Junk Science Wrapper
-
 Crime2 days ago
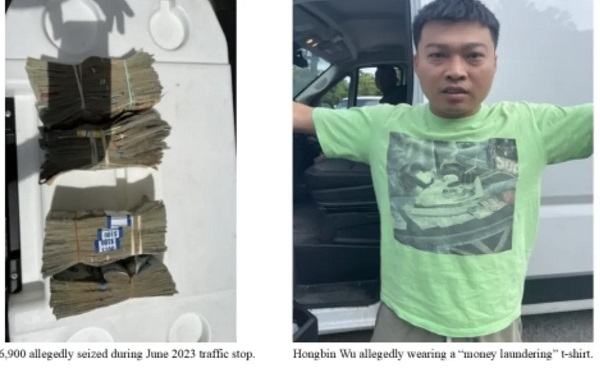
Sweeping Boston Indictment Points to Vast Chinese Narco-Smuggling and Illegal Alien Labor Plot via Mexican Border
-
 Business1 day ago
CBC six-figure salaries soar
-
 Business1 day ago
Trump slaps Brazil with tariffs over social media censorship
-
 Business1 day ago
Trump confirms 35% tariff on Canada, warns more could come
-
 National1 day ago
How Long Will Mark Carney’s Post-Election Honeymoon Last? – Michelle Rempel Garner