David Clinton
Is Marriage the Strongest Predictor of Wealth in Canada?


Love, they say, is a many-splendored thing. But I can tell you with confidence that, in Canada at least, it also pays handsomely.
Sharp downward trends in fertility rates are pointing to a bleak future. And as we’re discovering, immigration isn’t necessarily going to save us. Working on the reasonable assumption that the high costs of raising kids were holding us back, governments have been working for decades to encourage childbirth through programs like the Canada Child Tax Benefit. Their hearts were in the right place, but the result haven’t been great.
The Audit is a reader-supported publication. To receive new posts and support my work, consider becoming a free or paid subscriber.
The child and family support programs have been significant. For example, the average total of government support transfers in inflation-adjusted dollars paid to single parents have grown from $11,600 in 1976 to $19,400 in 2022. That amounts to around 29 percent of their average total earned income. Benefits for couples with children nearly tripled from a 1976 average of $5,800 to $15,300 by 2022. Those transfers included child benefits, employment insurance benefits, and social assistance.
But it turns out that even without government programs, marriage and parenting are both financially rewarding endeavors. In 2022, According to Statistics Canada, the average individual “not in an economic family” earned just $53,400 from both market (i.e., earned) income and government support. That same year, couples earned $135,600 – an increase of around 51 percent over what they would have earned in 1976. And the average couple with children took $169,900 home. For comparison, single parents earned just $80,100.
Of course it’s possible that couples who happen to be wealthier are more likely consider themselves capable of raising children, so to some extent they’re self-selecting. And some singles feel unable to start families because of crazy housing costs. Nevertheless, it seems that marriage and, to a lesser degree, parenthood are important predictors of higher income.
Are government social support programs behind the imbalance? Not so much. The average couple in 2022 received $7,300 in benefits, but that’s significantly less than the $9,800 that the average singles (without kids) got. In fact, it’s also a lot less than the $10,400 childless couples would have received from the government in 1976.
It’s clearly earned income that’s driving the greater wealth of both couples as a whole and couples with children.
This isn’t a new development. Throughout the half century since 1976 – when you exclude government benefits – couples have out-earned singles by an average of 140 percent. And couples with children have earned an average of 12.5 percent more than couples in general.
The bottom line is that couples – both with and without children – earn significantly more than both single parents and singles living outside of a family unit. This economic reality has persisted through financial crises, evolving government policy standards, and social upheavals.
That knowledge could play a role in young peoples’ thinking as they plan their lives. But it’s also one of many reasons that we, as a society, should aggressively protect the integrity of the family as an institution. All things being equal, families lead to better outcomes.
This idea is something found in no less a source than the United Nation’s Universal Declaration of Human Rights (Article 16):
The family is the natural and fundamental group unit of society and is entitled to protection by society and the State.
There is something a bit strange about all this data that I can’t explain. between 1990 and 2004, the difference between total income of couples with children and total income of single parents was significantly greater than the years either before or since.
Many things happened in the early 90’s that might have triggered the growing disparity (like the introduction of the Canada Child Tax Benefit, increasing access to childcare, or a narrowing gender pay gap), but none of them suddenly stopped in 2004. And one could imagine similar social and policy changes that might have reduced the disparity after 2004 (like increased female workforce participation), but none of them really began in 2005.
 |
That odd differential certainly looks real. But maybe it doesn’t mean anything. Sometimes a cigar is just a cigar. Any thoughts to share?
Subscribe to The Audit. If you already subscribe to the newsletter there’s more.. For the full experience, upgrade your subscription.
Thanks for considering The Audit. It also helps if you Refer a friend


Back in March 2024, I wrote about some early indications that Canada’s legalization of cannabis was, on balance, causing more harm than good. Well it looks like we’ve now moved past “early indications” and entered the “nervously searching for the exit” stage.
The new concerns follow the recent release of a couple of groundbreaking Canadian studies: Cannabis Use Disorder Emergency Department Visits and Hospitalizations and 5-Year Mortality which found evidence relating cannabis use to early death, and Convergence of Cannabis and Psychosis on the Dopamine System which describes a possible biological mechanism linking cannabis use to psychosis.
Canadian governments had very little moral liability for the medical consequences of cannabis use before they legalized it in 2018. However, legalization predictably led to a near doubling of consumption. In 2012, according to Statistics Canada, just 12.2 percent of Canadians 15 and over had used cannabis in the previous 12 months. By 2022, that number had climbed to 22 percent – representing nearly seven million Canadians. Cases of cannabis use disorder (CUD) treated in Ontario hospitals increased from just 456 in 2006 to 3,263 in 2021.
The government’s decision to legalize the drug¹ has arguably placed millions of additional people at risk of serious health outcomes.
Let’s take a look at the new evidence. The mortality study used hospital care and mortality data for more than eleven million Ontario residents. The researchers were given meaningful access to raw data from multiple government sources and were apparently compliant with all appropriate privacy regulations. They tracked 107,103 individuals who, between 2006 and 2021, were treated in an Ontario hospital for cannabis use disorder.
The main control group used for statistical comparison was all Ontarians. And the secondary control group was made up of individuals with incident hospital-based care for other substance use disorders, like alcohol, opioids, stimulants.
The primary outcome tracked by the study was all-cause mortality. The secondary outcome was mortality subdivided into alcohol poisoning, opioid poisoning, poisoning by other drugs, trauma, intentional self-harm, cancer, infection, diseases of the circulatory system, respiratory system, and gastrointestinal system.
The researchers adjusted for age, sex, neighborhood income quintile, immigrant status, and rurality (urban vs rural residence). They also controlled for comorbid mental health and care for substance use during the previous 3 years.
In other words, this looks like a well-constructed retrospective study based on excellent data resources.
What did they discover? People who received hospital-based care for cannabis use disorder were six times more likely to die early than the general population. And those CUD-related deaths lead to an average 1.8 life-years lost. After adjusting for demographic factors and other conditions, the added risk of early death was still three times greater than the general population. (Although people with CUD incidents were less likely to die young than those with other substance abuse disorders.)
CUD incidents were associated with increased risks for suicide (9.7 times higher), trauma (4.6 times higher), opioid poisoning (5.3 times higher), and cardiovascular and respiratory diseases (2 times higher).
The Convergence of Cannabis and Psychosis study was performed in and around London, Ontario. This one is a bit beyond my technical range, but they claim that:
Elevated dopamine function in a critical SN/VTA subregion may be associated with psychosis risk in people with CUD. Cannabis was associated with the hypothesized final common pathway for the clinical expression of psychotic symptoms.
Which does indicate that there may be more connecting cannabis to overall harm than just social or economic influences.
I’m not suggesting that the government should restore the original ban on cannabis. Like alcohol prohibition, the moment when that might have been possible is now long past. But I am wondering why politicians find it so difficult to wait for even minimal scientific evidence before driving the country over the cliff?

To my great surprise I recently noticed that, despite being deeply engaged in wars against at least four determined enemies, Israel doesn’t spend all that much more on their military than Canada does on its forces. What might that tell us about government efficiency?
There’s fairly universal agreement that Canada doesn’t spend enough on its military. But before we can even ask how much we should be spending, we should understand how much we’re already spending. And figuring that out isn’t nearly as easy as I’d expected.
According to the 2025–26 Expenditures by Purpose data released by the Treasury Board Secretariat, the Department of National Defence (DND) was allocated $35.7 billion (CAN). However, the New York Times recently reported that Primer Minister Carney’s $9.3 billion increase would bring the total defence-related spending to $62.7 billion – which suggests that, prior to the increase, we were set to spend $53.4 billion (CAN).
So I’ll work with both of those figures: $35.7 billion ($26 billion USD) and the pre-announcement $53.4 billion ($39 billion USD). By contrast, Israel currently spends around $37 billion (USD) on the Israel Defense Forces (IDF) which is in the neighborhood of 18 percent of their total budget.¹ The IDF is (literally) getting a much bigger bang for their buck.²
I’m going to compare the military inventories of both countries to get a sense of what a dollar of government spending can get you. I understand that this isn’t an apples-to-apples comparison and there are many complicating factors here. But I think the exercise could lead us to some useful insights. First off, here’s a very rough estimate of existing inventories:
 |
I’m sure there are plenty of caveats we could apply to those numbers, including how much of that equipment is actually fit for service on any given day. But they’ll have to do.
In addition, there are currently 68,000 regular troops in the Canadian Armed Forces (CAF) along with 22,500 reserves, while the IDF employs 169,500 regular troops and 465,000 reserves. They also cost money.
Based on some very rough estimates,³ I’d assess the value of IDF assets at around 2.6 times the value of comparable CAF assets. That means that the IDF – using their procurement systems – would need to spend just $14.4 billion (USD) to purchase the equivalent of the current set of CAF assets.
Now compare that with our actual (pre-increase) expenditures of either $26 billion USD or $39 billion USD and it seems that we’re overspending by either 80 percent or 270 percent.
I think we’d be wise to wonder why that is.
For full context, Israel receives around $3.8 billion (USD) in military aid annually from the U.S.
Speaking of which, for simplicity, I completely left the ongoing costs of ordinance out of my calculations.
If you’re really interested, you can see my calculations here.
Subscribe to The Audit.
For the full experience, upgrade your subscription.


Before Trudeau average annual immigration was 617,800. Under Trudeau number skyrocketted to 1.4 million annually
FDA requires new warning on mRNA COVID shots due to heart damage in young men
“This is a total fucking disaster”

Carney’s new agenda faces old Canadian problems

-
COVID-199 hours ago
FDA requires new warning on mRNA COVID shots due to heart damage in young men
-
Business7 hours ago
Carney’s new agenda faces old Canadian problems
-
 Indigenous8 hours ago
Internal emails show Canadian gov’t doubted ‘mass graves’ narrative but went along with it
-
 Daily Caller4 hours ago
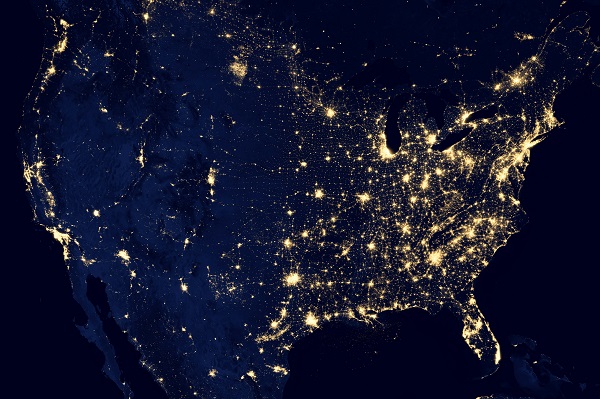
Blackouts Coming If America Continues With Biden-Era Green Frenzy, Trump Admin Warns
-
 Bruce Dowbiggin10 hours ago
Eau Canada! Join Us In An Inclusive New National Anthem
-
 Alberta2 days ago
Fourteen regional advisory councils will shape health care planning and delivery in Alberta
-
 Alberta2 days ago
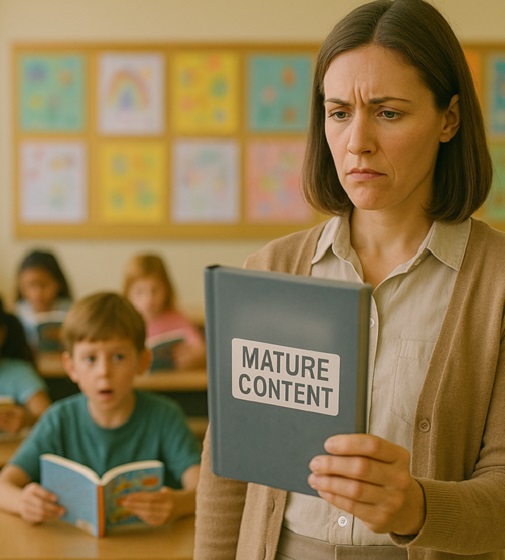
Alberta school boards required to meet new standards for school library materials with regard to sexual content
-
 Business2 days ago
UN’s ‘Plastics Treaty’ Sports A Junk Science Wrapper