Uncategorized
The Child Benefit You Got was Not an Error
The Child Benefit You Got was Not an Error
So a lot of people are wondering why money showed up for the Canada Child Benefit (CCB) yesterday (May 20) when they normally don’t qualify.
The CCB “one-time payment” for COVID-19 relief is actually formula driven but it is created by adding $3,600 for each additional child (not $300)… you’ll see in a minute why this is.
Step 1 – Add up the number of children that were under 6 years old in 2018 and multiply by $6,639.00
Step 2 – Add up the number of children that were between 6 and 17 years of age in 2018 and multiply by $5,602.00
This is your normal ANNUAL Canada Child Benefit entitlement before reductions.
However, for your May 2020 payment only, the formula adds $3,600 per child to bring the numbers to $10,239 and $9,202 per child based on age respectively.
If you have less than $31,120 of adjusted household income, you will get the full $300 extra, congrats, no more math for you.
For the rest of you it gets interesting or complicated, depending how you view math.
Any amount of adjusted household income between $31,120 and $67,426 causes your ANNUAL entitled CCB to be reduced by the following:
- 7% of the amount of household income if you have 1 child
- 13.5% of the amount of household income if you have 2 children
- 19% of the amount of household income if you have 3 children
- 23% of the amount of household income if you have 4 children or more
This is called the “first reduction”. The maximum amount of household income subject to the first reduction formula is $36,306 more than the base $31,120 (meaning an income of $65,976)
Those of you over this number, you are not done yet.
Any amount of adjusted household income over $67,426 causes your ANNUAL entitled CCB to be reduced by the following:
- 3.2% of the amount of household income if you have 1 child
- 5.7% of the amount of household income if you have 2 children
- 8% of the amount of household income if you have 3 children
- 9.5% of the amount of household income if you have 4 children or more
This is called the “second reduction”. There is no maximum amount of household income subject to the second reduction formula. You keep calculating until you hit zero.
For example. If you have one school-aged child in 2018, and your adjusted household income is $100,000 the formula would be this:
NORMAL MONTHLY BENEFIT:
- First reduction: 67,426-31,120 = $36,306 x 7% = $2,541.42
- Second reduction: 100,000-67,426 = $32,574 x 3.2% = $1,042.37
- 1 child: $5,602
- $5,602.00 minus $2,541.42 = $3,060.58 minus $1,042.37 = $2,018.21
- $2,978.21 divided by 12 = $168.18/month CCB as a Normal Benefit
COVID19 MAY 2020 BENEFIT:
- The first two reduction steps are the same but that 1 child is $3,600 more
- 1 child: $9,202
- $9,202.00 minus $2,541.42 = $6,660.58 minus $1,042.37 = $5,618.21
- $5,618.21 divided by 12 = $468.18/month CCB as a one-time Benefit (an extra $300 like promised)
So yes… an extra $300 per child for those already getting the benefit already… but for those that were not getting it before, but filed in 2018… and had an eligible child… the formula is recalculated with the $3,600 ($300 per month) change, and so many more households in Canada will be seeing some sort of amount.
For example, the lowest amount possible to collect would be with one school-aged child ($9,202 formula).
- Households that make up to $163,069 will receive the full $300 for this child.
- Households between $163,069 and $275,569 will receive less than $300 on a sliding scale from the Second reduction.
- Households over $275,569 in this scenario would receive zero.
So almost every household with eligible children in Canada will see something coming their way for the May benefit to help with the extra costs with no schools or dayhomes open.
Sincerely,
Your Friendly Neighbourhood Tax Nerds
CGL Strategic Business & Tax Advisors

![]()
![]()
![]()
![]()
CV of Cory G. Litzenberger, CPA, CMA, CFP, C.Mgr can be found here.
![]()
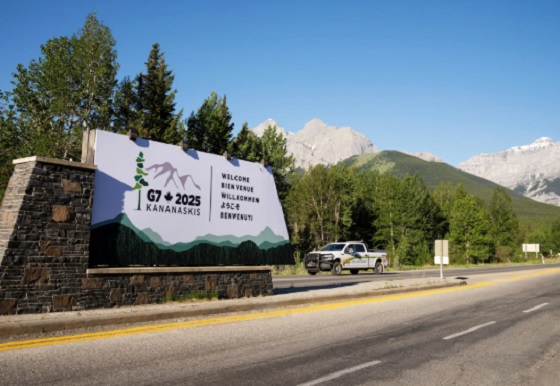
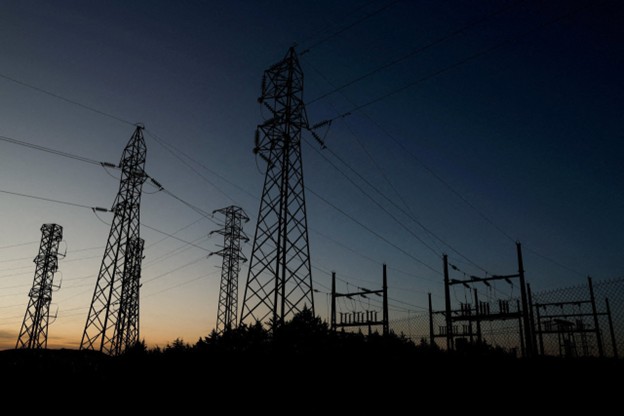
Energy security, resilience and affordability have long been protected by a continentally integrated energy sector.
The G7 summit in Kananaskis, Alberta, offers a key platform to reassert how North American energy cooperation has made the U.S. and Canada stronger, according to a joint statement from The Heritage Foundation, the foremost American conservative think tank, and MEI, a pan-Canadian research and educational policy organization.
“Energy cooperation between Canada, Mexico and the United States is vital for the Western World’s energy security,” says Diana Furchtgott-Roth, director of the Center for Energy, Climate and Environment and the Herbert and Joyce Morgan Fellow at the Heritage Foundation, and one of America’s most prominent energy experts. “Both President Trump and Prime Minister Carney share energy as a key priority for their respective administrations.
She added, “The G7 should embrace energy abundance by cooperating and committing to a rapid expansion of energy infrastructure. Members should commit to streamlined permitting, including a one-stop shop permitting and environmental review process, to unleash the capital investment necessary to make energy abundance a reality.”
North America’s energy industry is continentally integrated, benefitting from a blend of U.S. light crude oil and Mexican and Canadian heavy crude oil that keeps the continent’s refineries running smoothly.
Each day, Canada exports 2.8 million barrels of oil to the United States.
These get refined into gasoline, diesel and other higher value-added products that furnish the U.S. market with reliable and affordable energy, as well as exported to other countries, including some 780,000 barrels per day of finished products that get exported to Canada and 1.08 million barrels per day to Mexico.
A similar situation occurs with natural gas, where Canada ships 8.7 billion cubic feet of natural gas per day to the United States through a continental network of pipelines.
This gets consumed by U.S. households, as well as transformed into liquefied natural gas products, of which the United States exports 11.5 billion cubic feet per day, mostly from ports in Louisiana, Texas and Maryland.
“The abundance and complementarity of Canada and the United States’ energy resources have made both nations more prosperous and more secure in their supply,” says Daniel Dufort, president and CEO of the MEI. “Both countries stand to reduce dependence on Chinese and Russian energy by expanding their pipeline networks – the United States to the East and Canada to the West – to supply their European and Asian allies in an increasingly turbulent world.”
Under this scenario, Europe would buy more high-value light oil from the U.S., whose domestic needs would be back-stopped by lower-priced heavy oil imports from Canada, whereas Asia would consume more LNG from Canada, diminishing China and Russia’s economic and strategic leverage over it.
* * *
The MEI is an independent public policy think tank with offices in Montreal, Ottawa, and Calgary. Through its publications, media appearances, and advisory services to policymakers, the MEI stimulates public policy debate and reforms based on sound economics and entrepreneurship.
As the nation’s largest, most broadly supported conservative research and educational institution, The Heritage Foundation has been leading the American conservative movement since our founding in 1973. The Heritage Foundation reaches more than 10 million members, advocates, and concerned Americans every day with information on critical issues facing America.
Uncategorized
Poilievre on 2025 Election Interference – Carney sill hasn’t fired Liberal MP in Chinese election interference scandal

From Conservative Party Communications
“Yes. He must be disqualified. I find it incredible that Mark Carney would allow someone to run for his party that called for a Canadian citizen to be handed over to a foreign government on a bounty, a foreign government that would almost certainly execute that Canadian citizen.
“Think about that for a second. We have a Liberal MP saying that a Canadian citizen should be handed over to a foreign dictatorship to get a bounty so that that citizen could be murdered. And Mark Carney says he should stay on as a candidate. What does that say about whether Mark Carney would protect Canadians?
“Mark Carney is deeply conflicted. Just in November, he went to Beijing and secured a quarter-billion-dollar loan for his company from a state-owned Chinese bank. He’s deeply compromised, and he will never stand up for Canada against any foreign regime. It is another reason why Mr. Carney must show us all his assets, all the money he owes, all the money that his companies owe to foreign hostile regimes. And this story might not be entirely the story of the bounty, and a Liberal MP calling for a Canadian to be handed over for execution to a foreign government might not be something that the everyday Canadian can relate to because it’s so outrageous. But I ask you this, if Mark Carney would allow his Liberal MP to make a comment like this, when would he ever protect Canada or Canadians against foreign hostility?
“He has never put Canada first, and that’s why we cannot have a fourth Liberal term. After the Lost Liberal Decade, our country is a playground for foreign interference. Our economy is weaker than ever before. Our people more divided. We need a change to put Canada first with a new government that will stand up for the security and economy of our citizens and take back control of our destiny. Let’s bring it home.”
The Physics Behind The Spanish Blackout
So Alberta, what’s next?

War over after 12 days? Ceasefire reached between Israel, Iran

Canada should already be an economic superpower. Why is Canada not doing better?
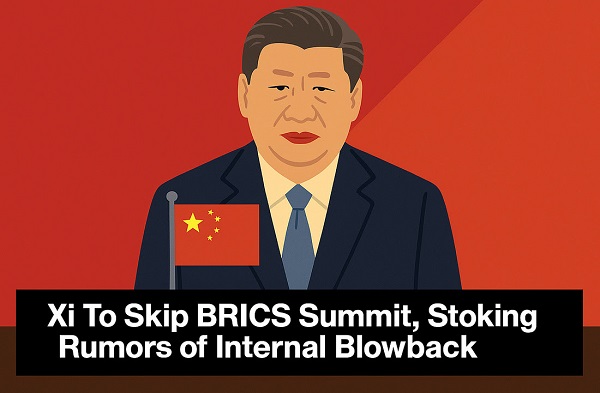
President Xi Skips Key Summit, Adding Fuel to Ebbing Power Theories

While China Hacks Canada, B.C. Sends Them a Billion-Dollar Ship Building Contract

Alberta Next Takes A Look At Alberta Provincial Police Force
-
 Brownstone Institute2 days ago
FDA Exposed: Hundreds of Drugs Approved without Proof They Work
-
 Energy1 day ago
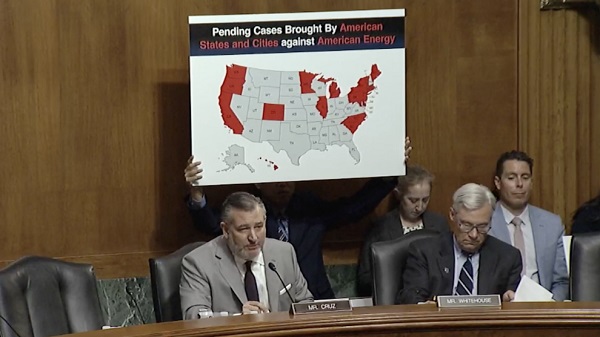
China undermining American energy independence, report says
-
 Automotive1 day ago
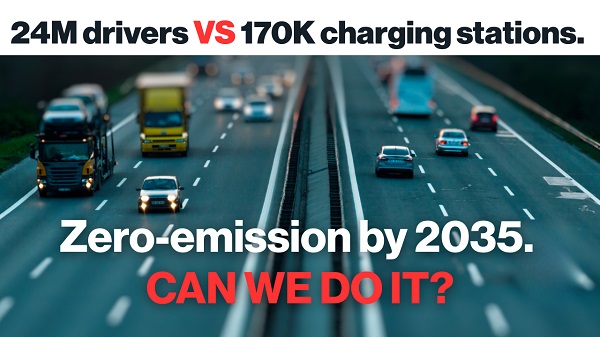
Electric vehicle sales are falling hard in BC, and it is time to recognize reality.
-
 Business1 day ago
Trump on Canada tariff deadline: ‘We can do whatever we want’
-
 Business1 day ago
Europe backs off greenwashing rules — Canada should take note
-
 Automotive1 day ago
Power Struggle: Electric vehicles and reality
-
 Business10 hours ago
Canada Caves: Carney ditches digital services tax after criticism from Trump
-
 Alberta3 hours ago
Alberta judge sides with LGBT activists, allows ‘gender transitions’ for kids to continue