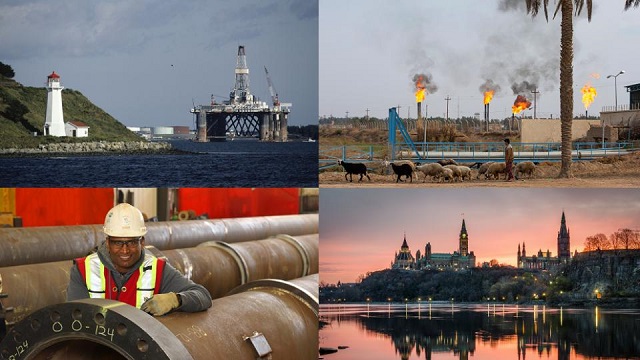
Alberta
25 facts about the Canadian oil and gas industry in 2023: Facts 1 to 5
From the Canadian Energy Centre
One of the things that really makes us Albertans, and Canadians is what we do and how we do it. It’s taking humanity a while to figure it out, but we seem to be grasping just how important access to energy is to our success. This makes it important that we all know at least a little about the industry that drives Canadians and especially Albertans as we make our way in the world.
The Canadian Energy Centre has compiled a list of 25 (very, extremely) interesting facts about the oil and gas industry in Canada. Over the 5 days we will post all 25 amazing facts, 5 at a time. Here are facts 6 to 10.
The Canadian Energy Centre’s 2023 reference guide to the latest research on Canada’s oil and gas industry
The following summary facts and data were drawn from 30 Fact Sheets and Research Briefs and various Research Snapshots that the Canadian Energy Centre released in 2023. For sources and methodology and for additional data and information, the original reports are available at the research portal on the Canadian Energy Centre website: canadianenergycentre.ca.
Environment
1. Canada’s share of Global CO2 emissions is dropping
Since the Kyoto Summit in 1997, Canada’s share of the world’s CO2 emissions has fallen from 2.2 per cent to 1.6 per cent. Canada’s share of world CO2 emissions decreased by 25 per cent from the Kyoto climate summit to the recent Dubai climate summit.

Source: CEC Research, Calculation from Various Database (2023)
2. Canadian natural gas is getting cleaner
Emissions intensity is the emission rate of a given pollutant relative to the intensity of a specific activity or industrial production process. Emissions intensity is determined by dividing the number of absolute emissions by some unit of output, such as GDP, energy used, population, or barrel of oil produced. Between 2010 and 2021, the CO2 emissions intensity of Canadian natural gas production fell from 63.5 kilograms CO2e per barrel of oil equivalent to 44.5 kilograms CO2e per barrel of oil equivalent, a decline of nearly 30 per cent.

Source: Derived from Rystad Energy
3. Canadian oil sands production is getting cleaner
Between 2000 and 2021, the emissions intensity of the oil sands subsector fell from 111.8 kilograms CO2e per barrel to just under 79.3 kilograms CO2e per barrel, a decline of over 29 per cent. As GHG emissions intensity in the upstream oil sector continues to decline and because Canada’s ESG performance remains highly rated, Canadian oil has the potential to become the barrel of choice on the world stage.

Source: Derived from Rystad Energy
4. Canada’s oil and gas sector is doing its part to reduce methane emissions
Gas flaring is the burning off of the natural gas that is generated in the process of oil extraction and production. It is a significant source of greenhouse gas emissions (GHGs). In 2022, 138,549 million cubic meters (m3) (or 139 billion cubic meters (bcm)) of flared gases were emitted worldwide, creating 350 million tonnes of CO2 emissions annually. At 945 million m3 in 2022, Canada was the eighth lowest flarer among the world’s top 30 oil and gas producers (23rd spot). Canada decreased its flaring emissions by 320 million m3 from its 2012 level of 1,264 million m3, a 25 per cent drop. In 2022, Canada contributed just 0.7 per cent of the global amount of gas flaring despite being the world’s fourth largest oil producer.

Source: World Bank (undated)
5. Environmental spending by Canada’s oil and gas sector remains high
Canadian businesses spent $28.6 billion on environmental protection between 2018 and 2020. When capital and operating expenses on environmental protection are combined, out of that $28.6 billion the oil and gas sector spent $9.4 billion, or nearly 33 per cent. In 2020 alone, when capital and operating expenses on environmental protection are combined, the oil and gas sector spent $2.7 billion, or 27 per cent of all Canadian business spending on the environment that year.

Source: Derived from Statistics Canada, Table 38-10-0130-01
CEC Research Briefs
Canadian Energy Centre (CEC) Research Briefs are contextual explanations of data as they relate to Canadian energy. They are statistical analyses released periodically to provide context on energy issues for investors, policymakers, and the public. The source of profiled data depends on the specific issue. This research brief is a compilation of previous Fact Sheets and Research Briefs released by the centre in 2023. Sources can be accessed in the previously released reports. All percentages in this report are calculated from the original data, which can run to multiple decimal points. They are not calculated using the rounded figures that may appear in charts and in the text, which are more reader friendly. Thus, calculations made from the rounded figures (and not the more precise source data) will differ from the more statistically precise percentages we arrive at using the original data sources.
About the author
This CEC Research Brief was compiled by Ven Venkatachalam, Director of Research at the Canadian Energy Centre.
Acknowledgements
The author and the Canadian Energy Centre would like to thank and acknowledge the assistance of an anonymous reviewer for the review of this paper.
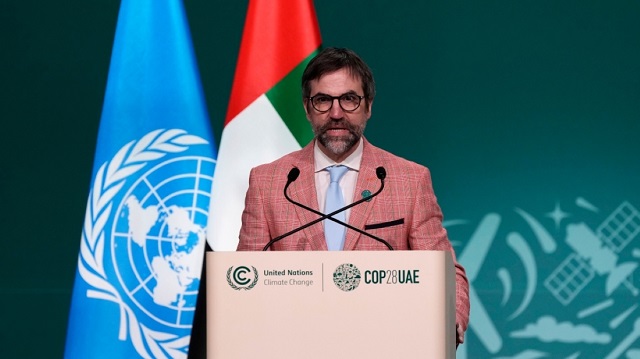
Minister of Environment and Protected Areas Rebecca Schulz issued the following statement:
“Every modern convenience and necessity is either made from or contains plastic, from surgical gloves to your iPhone. Despite this, Minister of Environment and Climate Change Canada Steven Guilbeault has announced that he intends to cap the production of plastics in Canada.
“This unilateral announcement is a slap in the face to Alberta and our province’s petrochemical industry, and the thousands of Albertans who work in it.
“Plastics production is a growing part of Alberta’s economy, and we are positioned to lead the world for decades to come in the production of carbon neutral plastics.
“Minister Guilbeault’s proposal would throw all of that into jeopardy and risk billions of dollars in investments. This includes projects like Dow Chemical’s net-zero petrochemical plant in Fort Saskatchewan, a $9-billion dollar project that will create thousands of jobs.
“His proposal will also fail to reduce plastic production. If the federal government limits plastic production in Canada, other counties like China will just produce more. The only outcome that this federal government will achieve will be fewer jobs in Canada.
“Last year, the Federal Court ruled that Minister Guilbeault’s decision to classify plastics as ‘toxic’ was both ‘unconstitutional and unreasonable’.
“Minister Guilbeault’s decision to cap production is even more egregious and is equally unconstitutional. Under no circumstances will Alberta permit any limit on our ability to produce and export plastic products.
“Instead of wasting everyone’s time, the federal government would be better served by taking a page out of Alberta’s plan, which diverts plastics from landfills and turns used plastics into new products. This is the promise of Alberta’s plan to create a Plastics Circular Economy, a modern miracle in which, through chemistry, we can have all of life’s conveniences and necessities while protecting our environment and reducing plastic waste.
“If the federal government refuses to abide by the constitution, we will take them to court again to defend our jurisdiction and the thousands of Albertans who work in the petrochemical sector.”

From the Montreal Economic Institute
Quebec has experienced increased productivity and efficiency, as well as reduced costs, in those sectors to which ABF has been applied
Alberta’s healthcare system costs more than those of many of its peers across Canada and internationally, yet underperforms by many metrics—wait times perhaps being the most visible.(1) For instance, while Alberta consistently spends a fair deal more per capita on health care than Canada’s other large provinces do, the median wait time from referral by a GP to treatment by a specialist was 33.3 weeks in 2022, versus 29.4 weeks in Quebec, 25.8 weeks in British Columbia, and 20.3 weeks in Ontario. Albertans waited a median 232 days for a hip replacement that year, longer than those in Quebec, British Columbia, and Ontario.(2) In Australia, meanwhile, the median wait time for a total hip replacement in 2022 was 175 days in public hospitals.(3)
One of the things keeping Alberta’s healthcare system from better performance is that it relies on global budgets for its hospital financing. Such a system allocates a pre-set amount of funding to pay for an expected number of services, based largely on historical volume. The problem with global budgets is that they disregard the actual costs incurred to deliver care, while undermining incentives to improve outcomes. This ultimately leads to rationing of care, with patients viewed as a cost that must be managed.
Activity-based funding systems are associated with reduced hospital costs, increased efficiency, and shorter wait times, among other things.
An alternative is activity-based funding (ABF), which has largely replaced global budgeting in many OECD countries, and is starting to do so in some Canadian provinces.(4) With ABF, hospitals receive a fixed payment for each specific service delivered, adjusted for certain parameters.(5) If a hospital treats more patients and delivers more services, it receives more funding; if it does less, it receives less. In essence, the money follows the patient, which has a dramatic effect: patients are now viewed as a source of revenue, not merely as a cost. Studies have shown that ABF systems that include appropriate safeguards for quality and waste are associated with reduced hospital costs, increased efficiency, and shorter wait times, among other things.(6)
To increase its capacity and performance, Alberta should consider moving to such a system for hospital financing. As over 25% of total health spending in the province goes to hospitals,(7) driving down costs and finding efficiencies is of paramount importance.
ABF models vary by jurisdiction and context to account for distinct situations and the particular policy objectives being pursued.(8) Two jurisdictions provide interesting insights: Quebec, with ABF hospital funding being gradually implemented in recent years, and Australia, where after more than three decades, ABF is the rule, global budgets the exception.
ABF in Quebec: Increased Performance and Decreased Costs
Quebec’s hospital payment reforms over the past two decades have been aimed at better linking funding with health care delivery to improve care quality and access.(9) These patient-based funding reforms (a type of ABF) have resulted in increased volumes and efficiency, and reduced costs and wait times for a number of surgical and other procedures in Quebec.(10)
These reforms started in 2004, when Quebec applied ABF in the context of additional funding to select surgeries in order to reduce wait times through the Access to Surgery Program.(11) The surgeries initially targeted were hip replacement, knee replacement, and cataract surgeries, but other procedures were eventually integrated into the program as well. Its funding covered the volume of surgeries that exceeded those performed in 2002-2003, and it used the average cost for each specific surgery. Procedures were classified by cost category, which also took into account the intensity of resource use and unit cost based on direct and indirect costs.
The expansion of ABF in Quebec aims to relieve hospital congestion by driving down wait times and shrinking wait lists.
By 2012-2013, this targeted program had helped to significantly increase the volume of surgeries performed, as well as decrease wait times and length of stay.(12) However, as ABF was applied only to surplus volumes of additional surgeries, efficiency gains were limited. For this reason, among others, the Expert Panel for Patient-Based Funding recommended expanding the program,(13) and in 2012, the Government of Quebec began considering further pilot projects for gradual ABF implementation.(14)
- In 2015, ABF was implemented in the radiation oncology sector, which resulted in better access to services at a lower cost, with productivity having increased more than 26% by 2023-2024, and average procedure costs having fallen 7%.(15)
- In 2017-2018, ABF was implemented in imaging, which resulted in the number of magnetic resonance imaging tests increasing more than 22% while driving the unit cost of procedures down 4%.(16)
- Following the above successes, in 2018-2019, the colonoscopy and digestive endoscopy sector also moved to ABF, which led to a productivity increase of 14% and a 31% decrease in the case backlog.(17)
Overall, then, Quebec has experienced increased productivity and efficiency, as well as reduced costs, in those sectors to which ABF has been applied (see Figure 1).

The Department of Health and Social Services continued to expand ABF to more surgeries in 2023, following which it was expected that about 25% of the care and services offered in physical health in Quebec hospitals would be funded in this manner, with the goal of reaching 100% by 2027-2028.(18) Further, the 2024-2025 budget expanded ABF again to include the medicine, emergency, neonatal, and dialysis sectors.
This expansion of ABF aims to relieve hospital congestion by driving down wait times and shrinking wait lists.(19) It will also align Quebec’s health care funding with what has become standard in most OECD countries. In Australia, for instance, ABF is the rule, not the exception, covering a large proportion of hospital services.
Australia’s Extensive Use of ABF
Australia also implemented ABF in stages, as Quebec is now doing. It was first introduced in the 1990s in one state and adopted nationally in 2012 for all admitted programs to increase efficiency, while also integrating quality and safety considerations.(20) These considerations act as safeguards to ensure efficiency incentives don’t negatively impact services. For instance, there are adjustments to the ABF payment framework in the presence of hospital acquired complications and avoidable hospital readmissions, two measures of hospital safety and service quality.(21) If service quality were to decrease, funding would be adjusted, and payments would be withheld. Not only has ABF been successful in increasing hospital efficiency in Australia, but it has also enabled proactive service improvement, which has in turn had a positive impact on safety and quality.(22)
ABF now makes up 87.0% of total hospital spending in Australia, ranging from 83.6% in Tasmania to 93.0% in the Australian Capital Territory.
Currently, ER services, acute services, admitted mental health services, sub-acute and non-acute services, and non-admitted services are funded with ABF in Australia. This includes rehabilitation, palliative, geriatric and/or maintenance care.(23) Global budgets are still used for some block funding, but this is the exception, restricted to certain hospitals, programs, or specific episodes of care.(24) Small rural hospitals, non-admitted mental health programs, and a few other highly specialized therapies or clinics or some community health services tend to be block funded due to higher than average costs stemming from a lack of economies of scale and inadequate volumes, among other things.
When first introduced, ABF made up about 25% of hospital revenue (approximately where Quebec currently stands).(25) ABF now makes up 87.0% of total hospital spending in Australia, ranging from 83.6% in Tasmania to 93.0% in the Australian Capital Territory (see Figure 2).

There is more variability, however, at the local hospital network level within territories or states. For instance, between 2019 and 2024, an average of 92.3% of total funding for the hospitals in the South Eastern Sydney Local Health District was ABF, and just 7.7% was block funding.(26) For the hospitals in the Far West Local Health District, in comparison, ABF represented an average of 72.0% of total funding, and block payments 28.0%, over the same period.(27)
The proportion of ABF funding per hospital is dictated, for the most part, by the types and volumes of patient services provided, but also by hospital characteristics and regional patient demographics.(28) For example, there could be a need to compensate for differences in hospital size and location, or to reimburse for some alternative element of the fixed cost of providing services. In the Far West Local Health District, on average 65.1% of block funding between 2019-2020 and 2023-2024 was provided for small rural hospitals, while only 1.4% of the block funding in the South Eastern Sydney Local Health District was for these types of hospitals.(29) Ultimately, these two districts serve very different populations, with the Far West Local Health District being the most thinly populated district in Australia.(30)
Overall, ABF implementation in Australia has significantly improved hospital performance. Early after ABF implementation, the volume of care in Australia increased, and waiting lists decreased by 16% in the first year.(31) Between 2005 and 2017 the hospitals that were funded by ABF in Queensland became more efficient than those receiving block funding.(32) In addition, ABF can contribute to reductions in extended lengths of stay and hospital readmission,(33) both of which are expensive propositions for health care systems and also tie up hospital beds and resources.
Conclusion
ABF has been associated with reduced hospital costs, increased efficiency, and shorter wait times, areas where Alberta is lacking and reform is needed. To increase its health system performance, Alberta should consider emulating Quebec and moving to an activity-based funding system. Indeed, based on the experience of countries like Australia, widespread application should be the goal, as it is in Quebec. Alberta patients have already waited far too long for timely access to the quality care they deserve. The time to act is now.
The MEI study is available here.
* * *
This Economic Note was prepared by Krystle Wittevrongel, Senior Policy Analyst and Alberta Project Lead at the MEI. The MEI’s Health Policy Series aims to examine the extent to which freedom of choice and entrepreneurship lead to improvements in the quality and efficiency of health care services for all patients.
The MEI is an independent public policy think tank with offices in Montreal and Calgary. Through its publications, media appearances, and advisory services to policy-makers, the MEI stimulates public policy debate and reforms based on sound economics and entrepreneurship.

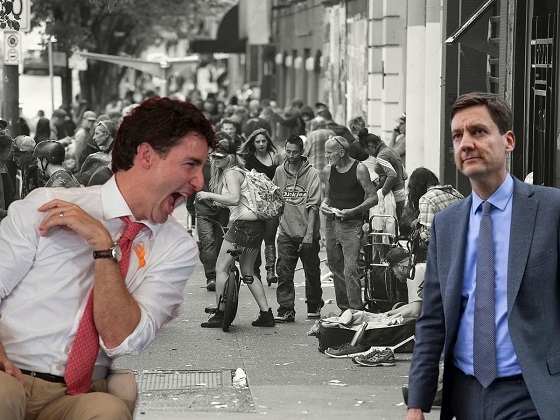
Fentanyl Fiasco: The Tragic Missteps of BC’s Drug Policy
Powerful players count on corruption of ideal carbon tax

German parliament passes law allowing minors to change their legal gender once a year
Maxime Bernier says it’s ‘astounding’ Alberta is ‘pushing’ COVID boosters, tells Danielle Smith to stop it
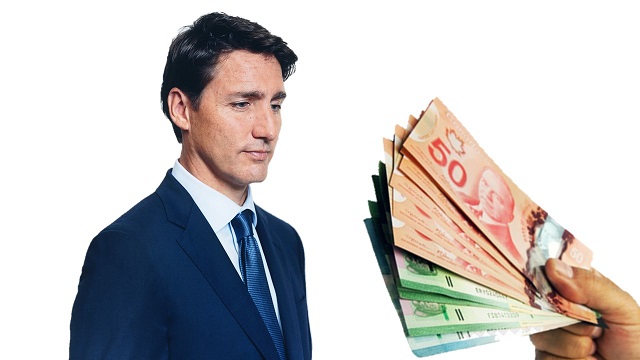
Trudeau gov’t pledges $42 million to the CBC to promote ‘independent journalism’

Canada’s economy has stagnated despite Ottawa’s spin

Canadian receives one-year jail sentence, lifetime firearms ban for setting church on fire

-
 conflict1 day ago
Col. Douglas Macgregor torches Trump over support for bill funding wars in Ukraine and Israel
-
 Alberta22 hours ago
Red Deer Doctor critical of Alberta’s COVID response to submit report to Danielle Smith this May
-
 Business5 hours ago
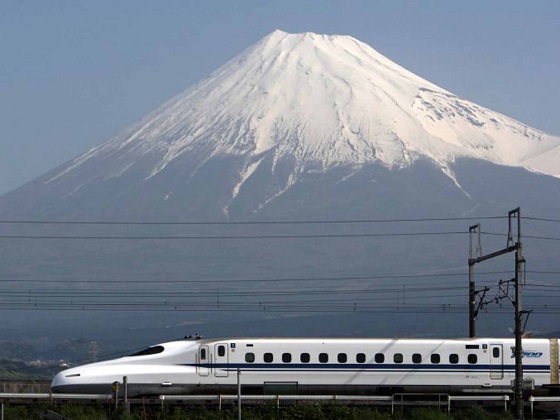
Don’t be fooled by high-speed rail
-
Alberta5 hours ago
Activity-Based Hospital Funding in Alberta: Insights from Quebec and Australia
-
 Business2 days ago
Federal government’s ‘fudget budget’ relies on fanciful assumptions of productivity growth
-
 Business3 hours ago
UN plastics plans are unscientific and unrealistic
-
 International1 day ago
Biden admin expands Title IX to include ‘gender identity,’ sparking conservative backlash
-
 Business2 hours ago
Taxpayers criticize Trudeau and Ford for Honda deal