Canadian Energy Centre
Business leaders blast Ottawa’s ‘unnecessary and unacceptable’ oil and gas emissions cap

From the Canadian Energy Centre
The federal government is proceeding with its plans to cap emissions from the oil and gas industry in a move business leaders say will ultimately hurt Indigenous communities and everyday Canadians.
The Business Council of Canada called the cap part of a “full-on charge against the oil and gas sector.”
The government announced on December 7 that it will implement measures to cap oil and gas emissions in 2030 at 35 to 38 percent below 2019 levels. A similar cap has not been announced for any other industry.
“It all seems punitive and short-sighted,” wrote Business Council of Canada vice-president Michael Gullo and Theo Argitis, managing director of Compass Rose Group.
A cap on production
They don’t put much stock into the government’s claims that the cap is not intended to limit Canada’s oil and gas production.
“That’s semantics. To work, a cap would ultimately need to be severe enough to curtail production if needed, and that would have significant economic consequences,” Gullo and Argitis said, warning of a “direct and immediate” loss of income for Canada’s economy.
“There would be significant indirect costs as well, incurred by every household and business across the nation because Canada relies on income generated by oil and gas companies—totaling $270 billion in 2022 alone—to support social programs like health care, education, and infrastructure,” they wrote.
Already on the path to net zero
On the world’s current trajectory, oil and gas will still account for 46 per cent of world energy needs in 2050, down only moderately from 51 per cent in 2022, according to the International Energy Agency.
Industry leaders argue that Canada’s oil and gas producers are already on the path to net zero emissions without the need for the cap.
According to Environment and Climate Change Canada’s latest report to the United Nations, emissions from so-called “conventional” (non-oil sands) production declined to 26 megatonnes in 2021, from 34 megatonnes in 2019.
Producers in Alberta have already reduced total methane emissions by 45 per cent compared to 2014, hitting the target three years ahead of schedule.
Oil sands emissions did not increase last year despite production growth, and total emissions are expected to start going down before 2025, according to S&P Global.

“Imposing an emissions cap on Canada’s oil and gas producers, who are already achieving significant emissions reductions as shown in the federal government’s own data, is unnecessary and unacceptable,” the Explorers and Producers Association of Canada said in a statement.
A cap on Indigenous opportunity
The Indigenous Resource Network (IRN) – which advocates for Indigenous participation in resource projects – said the cap would be “devastating” for Indigenous communities.
“A pathway to self-determination is being achieved through the ownership of oil and gas projects and involvement in the sector,” said IRN executive director John Desjarlais.
“This would result in a cap on Indigenous opportunity in the oil and gas sector.”
Desjarlais said the IRN is seeking an exemption from the cap for Indigenous communities who are engaged in oil and gas development.
He said the proposed cap directly contradicts the government’s promises on reconciliation and its support for the United Nations Declaration on the Rights of Indigenous People.
Counter–approach to the United States
The approach of capping emissions runs counter to the incentive-based approach being pursued in the United States, the Canadian Association of Energy Contractors (CAOEC) said in a statement.
“There, the Inflation Reduction Act has attracted capital and accelerated low-carbon technology and innovation in the energy sector at the expense of Canadian businesses and workers,” the CAOEC said.
Ottawa has yet to finalize announced investment tax credits to support clean technologies like hydrogen production and carbon capture, utilization and storage (CCUS), the Business Council of Canada noted.
“We have engaged the federal government in good faith over the past two years and have asked them to partner with us to accelerate the deployment of carbon abatement technology. As of today, we have received no support from this government,” said CAOEC president Mark Scholz.
“Stop working against us and start working with us.”
Final regulations on the proposed emissions cap are expected in 2025.

Alberta
Game changer: Trans Mountain pipeline expansion complete and starting to flow Canada’s oil to the world
Workers complete the “golden weld” of the Trans Mountain pipeline expansion on April 11, 2024 in the Fraser Valley between Hope and Chilliwack, B.C. The project saw mechanical completion on April 30, 2024. Photo courtesy Trans Mountain Corporation
From the Canadian Energy Centre
By Will Gibson
‘We’re going to be moving into a market where buyers are going to be competing to buy Canadian oil’
It is a game changer for Canada that will have ripple effects around the world.
The Trans Mountain pipeline expansion is now complete. And for the first time, global customers can access large volumes of Canadian oil, with the benefits flowing to Canada’s economy and Indigenous communities.
“We’re going to be moving into a market where buyers are going to be competing to buy Canadian oil,” BMO Capital Markets director Randy Ollenberger said recently, adding this is expected to result in a better price for Canadian oil relative to other global benchmarks.
The long-awaited expansion nearly triples capacity on the Trans Mountain system from Edmonton to the West Coast to approximately 890,000 barrels per day. Customers for the first shipments include refiners in China, California and India, according to media reports.
Shippers include all six members of the Pathways Alliance, a group of companies representing 95 per cent of oil sands production that together plan to reduce emissions from operations by 22 megatonnes by 2030 on the way to net zero by 2050.
The first tanker shipment from Trans Mountain’s expanded Westridge Marine Terminal is expected later in May.
 Photo courtesy Trans Mountain Corporation
The new capacity on the Trans Mountain system comes as demand for Canadian oil from markets outside the United States is on the rise.
According to the Canada Energy Regulator, exports to destinations beyond the U.S. have averaged a record 267,000 barrels per day so far this year, up from about 130,000 barrels per day in 2020 and 33,000 barrels per day in 2017.
“Oil demand globally continues to go up,” said Phil Skolnick, New York-based oil market analyst with Eight Capital.
“Both India and China are looking to add millions of barrels a day of refining capacity through 2030.”
In India, refining demand will increase mainly for so-called medium and heavy oil like what is produced in Canada, he said.

“That’s where TMX is the opportunity for Canada, because that’s the route to get to India.”
Led by India and China, oil demand in the Asia-Pacific region is projected to increase from 36 million barrels per day in 2022 to 52 million barrels per day in 2050, according to the U.S. Energy Information Administration.
More oil coming from Canada will shake up markets for similar world oil streams including from Russia, Ecuador, and Iraq, according to analysts with Rystad Energy and Argus Media.
Expanded exports are expected to improve pricing for Canadian heavy oil, which “have been depressed for many years” in part due to pipeline shortages, according to TD Economics.
 Photo courtesy Trans Mountain Corporation
In recent years, the price for oil benchmark Western Canadian Select (WCS) has hovered between $18-$20 lower than West Texas Intermediate (WTI) “to reflect these hurdles,” analyst Marc Ercolao wrote in March.
“That spread should narrow as a result of the Trans Mountain completion,” he wrote.
“Looking forward, WCS prices could conservatively close the spread by $3–4/barrel later this year, which will incentivize production and support industry profitability.”
Canada’s Parliamentary Budget Office has said that an increase of US$5 per barrel for Canadian heavy oil would add $6 billion to Canada’s economy over the course of one year.
The Trans Mountain Expansion will leave a lasting economic legacy, according to an impact assessment conducted by Ernst & Young in March 2023.
In addition to $4.9 billion in contracts with Indigenous businesses during construction, the project leaves behind more than $650 million in benefit agreements and $1.2 billion in skills training with Indigenous communities.
Ernst & Young found that between 2024 and 2043, the expanded Trans Mountain system will pay $3.7 billion in wages, generate $9.2 billion in GDP, and pay $2.8 billion in government taxes.
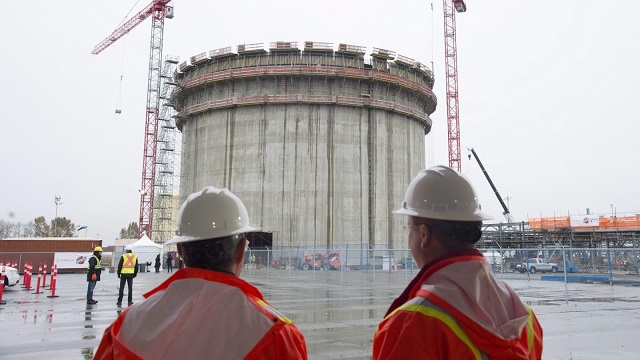
Construction workers look on at the FortisBC Tilbury LNG expansion project in Delta, B.C., Monday, Nov. 16, 2015. CP Images photo
From the Canadian Energy Centre
Lower costs for natural gas, shipping and liquefaction give Canada an edge in the emerging global LNG market
Worldwide concerns about energy security have put a renewed focus on the international liquefied natural gas (LNG) industry. The global demand for LNG is expected to increase over the next few decades.
Global demand growth will be driven primarily by Asian markets where the need for LNG is expected to increase from 277 million tonnes (MT) in 2025 to 509 MT by 2050 (see Figure 1). By 2050 the demand for LNG in Europe will be 83 MT and in Africa 20 MT. In South America too, demand will increase – from 13 MT in 2025 to 31 MT in 2050.

Source: Derived from Rystad Energy, Gas and LNG Markets Solution.
In North America (Canada, Mexico, and United States) a number of LNG projects that are either under construction or in the planning stages will benefit from the rise in global LNG demand.
North American LNG production is expected to grow from 112 MT in 2025 to over 255 MT by 2050 (see Figure 2). In Canada, the LNG projects under construction or in the planning stages include LNG Canada Phases 1 & 2, Woodfibre LNG, Cedar LNG, the Tilbury LNG expansion, and Ksi Lisims LNG. Canada’s LNG production is expected to grow from just 2 MT in 2025 to over 43 MT by 2050. In the United States production is projected to increase from 108 MT in 2025 to 210 MT in 2050.

Source: Derived from Rystad Energy, Gas and LNG Markets Solution.
This CEC Fact Sheet uses Rystad Energy’s Gas and LNG Markets Solution¹ to benchmark the cost competitiveness of LNG projects that are under construction and proposed in Canada compared to other LNG projects under construction and planned elsewhere in North America. (Note that the content of this report does not represent the views of Rystad Energy.)
The LNG cost competitiveness benchmarking analysis used the following performance metrics:
- LNG plant free-on-board (FOB) cost break-even;
- Total LNG plant cost (for delivery into Asia and Europe).
The objective of this LNG cost competitiveness benchmarking is to compare the competitiveness of Canadian LNG projects against those of major competitors in the United States and Mexico. The selection of other North American LNG facilities for the benchmark comparison with Canadian LNG projects (LNG Canada, the Tilbury LNG Expansion, Woodfibre LNG, Cedar LNG, and Ksi Lisims LNG) is based on the rationale that virtually all Canadian LNG plants are under construction or in the planning stage and that they compare well with other North American LNG plants that are also under construction or are being planned between 2023 and 2050. Further, to assess the cost competitiveness of the various LNG projects more accurately, we chose only North American LNG facilities with sufficient economic data to enable such a comparison. We compared the cost competitiveness of LNG coming from these other North American projects with LNG coming from Canada that is intended to be delivered to markets in Asia and Europe.
1. Rystad Energy is an independent energy research company providing data, analytics, and consultancy services to clients around the globe. Its Gas and LNG Markets Solution provides an overview of LNG markets worldwide. The Solution covers the entire value chain associated with gas and LNG production, country and sector-level demand, and LNG trade flows, infrastructure, economics, costs, and contracts through 2050. It allows for the evaluation of the entire LNG market infrastructure, including future planned projects, as well as the benchmarking of costs for LNG projects (Rystad Energy, 2024).
Comparison of LNG project FOB cost break-even (full cycle)
Figure 3 provides a comparison of the free-on-board (FOB) cost break-even for LNG facilities under construction or being planned in North America. FOB break-even costs include upstream and midstream costs for LNG excluding transportation costs (shipping) as seen from the current year. Break-even prices assume a discount rate of 10 percent and represent the point at which the net present value for an LNG project over a 20- to 30-year period becomes positive, including the payment of capital and operating costs, inclusive of taxes.
Among the selected group of North American LNG projects are Canadian LNG projects with an FOB break-even at the lower end of the range (US$7.18 per thousand cubic feet (kcf)) to those at the higher end (US$8.64 per thousand cubic feet (kcf)).
LNG projects in the United States tend to settle in the middle of the pack, with FOB break-even between US$6.44 per kcf and US$8.37 per kcf.
Mexico LNG projects have the widest variation in costs among the selected group of projects, ranging from US$6.94 per kcf to US$9.44 per kcf (see Figure 3).

Source: Derived from Rystad Energy, Gas and LNG Markets Solution.
Total costs by project for LNG delivery to Asia and Europe
The total cost by LNG plant includes FOB cost break-even, transportation costs, and the regasification tariff. Figure 4 compares total project costs for LNG destined for Asia from selected North American LNG facilities.
Canadian LNG projects are very cost competitive, and those with Asia as their intended market tend to cluster at the lower end of the scale. The costs vary by project, but range between US$8.10 per kcf and US$9.56 per kcf, making Canadian LNG projects among the lowest cost projects in North America.
The costs for Mexico’s LNG projects with Asia as the intended destination for their product tend to cluster in the middle of the pack. Costs among U.S. LNG facilities that plan to send their product to Asia tend to sit at the higher end of the scale, at between US$8.90 and US$10.80 per kcf.

Source: Derived from Rystad Energy, Gas and LNG Markets Solution.
Figure 5 compares total project costs for LNG to be delivered to Europe from select North American LNG facilities.
Costs from U.S. LNG facilities show the widest variation for this market at between US$7.48 per kcf and US$9.42 per kcf, but the majority of U.S. LNG facilities tend to cluster at the lower end of the cost scale, between US$7.48 per kcf and US$8.61 per kcf (see Figure 5).
Canadian projects that intend to deliver LNG to Europe show a variety of costs that tend to cluster at the middle to higher end of the spectrum, ranging from US$9.60 per kcf to and US$11.06 per kcf.
The costs of Mexico’s projects that are aimed at delivering LNG to Europe tend to cluster in the middle of the spectrum (US$9.11 per kcf to US$10.61 per kcf).

Source: Derived from Rystad Energy, Gas and LNG Markets Solution.
Conclusion
LNG markets are complex. Each project is unique and presents its own challenges. The future of Canadian LNG projects depends upon the overall demand and supply in the global LNG market. As the demand for LNG increases in the next decades, the world will be searching for energy security.
The lower liquefaction and shipping costs coupled with the lower cost of the natural gas itself in Western Canada translate into lower prices for Canadian LNG, particularly that destined for Asian markets. Those advantages will help make Canadian LNG very competitive and attractive to markets worldwide.


Trudeau’s internet censorship Bill C-11 will not be implemented until late 2025

‘What’s The Problem?’: Zelenskyy Says NATO Needs To ‘Shoot Down’ Russian Missiles In Ukraine’s Airspace

UK set to ban sex ed for young children amid parental backlash against LGBT indoctrination

Tucker Carlson and NFL star Aaron Rodgers discuss Bill Gates, COVID-19, US Deep State
-
conflict18 hours ago
‘What’s The Problem?’: Zelenskyy Says NATO Needs To ‘Shoot Down’ Russian Missiles In Ukraine’s Airspace
-
 DEI2 days ago
Lawmakers press investigation into DEI agenda at the Pentagon
-
 COVID-197 hours ago
Saskatchewan appeals court upholds COVID-era gov’t restrictions on outdoor gatherings
-
 Food1 day ago
The Bee-pocalypse: Another Scare Story the Media Got Wrong
-
 International17 hours ago
Julian Assange wins right to appeal extradition to US, remains in UK prison for now
-
 Bruce Dowbiggin2 days ago
Lather, Rinse, Repeat: Recycling Coaches In The NHL
-
 COVID-1910 hours ago
Biden’s Navy secretary says he has ‘no regrets’ about firing 5,000+ unvaxxed sailors, Marines
-
 Alberta1 day ago
Free Alberta Strategy petition demanding PM Trudeau fire Steven Guilbeault passes 13,000 signatures