Canadian Energy Centre
North America LNG project cost competitiveness
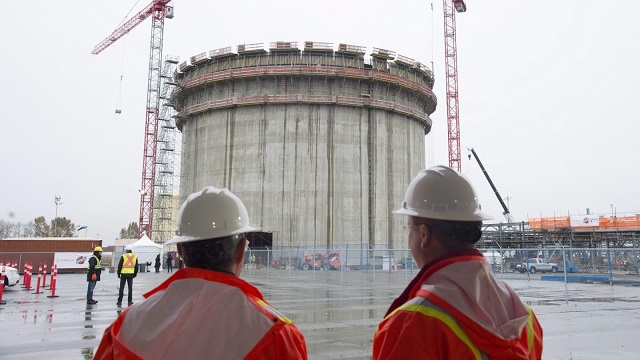
Construction workers look on at the FortisBC Tilbury LNG expansion project in Delta, B.C., Monday, Nov. 16, 2015. CP Images photo
From the Canadian Energy Centre
Lower costs for natural gas, shipping and liquefaction give Canada an edge in the emerging global LNG market
Worldwide concerns about energy security have put a renewed focus on the international liquefied natural gas (LNG) industry. The global demand for LNG is expected to increase over the next few decades.
Global demand growth will be driven primarily by Asian markets where the need for LNG is expected to increase from 277 million tonnes (MT) in 2025 to 509 MT by 2050 (see Figure 1). By 2050 the demand for LNG in Europe will be 83 MT and in Africa 20 MT. In South America too, demand will increase – from 13 MT in 2025 to 31 MT in 2050.

Source: Derived from Rystad Energy, Gas and LNG Markets Solution.
In North America (Canada, Mexico, and United States) a number of LNG projects that are either under construction or in the planning stages will benefit from the rise in global LNG demand.
North American LNG production is expected to grow from 112 MT in 2025 to over 255 MT by 2050 (see Figure 2). In Canada, the LNG projects under construction or in the planning stages include LNG Canada Phases 1 & 2, Woodfibre LNG, Cedar LNG, the Tilbury LNG expansion, and Ksi Lisims LNG. Canada’s LNG production is expected to grow from just 2 MT in 2025 to over 43 MT by 2050. In the United States production is projected to increase from 108 MT in 2025 to 210 MT in 2050.

Source: Derived from Rystad Energy, Gas and LNG Markets Solution.
This CEC Fact Sheet uses Rystad Energy’s Gas and LNG Markets Solution¹ to benchmark the cost competitiveness of LNG projects that are under construction and proposed in Canada compared to other LNG projects under construction and planned elsewhere in North America. (Note that the content of this report does not represent the views of Rystad Energy.)
The LNG cost competitiveness benchmarking analysis used the following performance metrics:
- LNG plant free-on-board (FOB) cost break-even;
- Total LNG plant cost (for delivery into Asia and Europe).
The objective of this LNG cost competitiveness benchmarking is to compare the competitiveness of Canadian LNG projects against those of major competitors in the United States and Mexico. The selection of other North American LNG facilities for the benchmark comparison with Canadian LNG projects (LNG Canada, the Tilbury LNG Expansion, Woodfibre LNG, Cedar LNG, and Ksi Lisims LNG) is based on the rationale that virtually all Canadian LNG plants are under construction or in the planning stage and that they compare well with other North American LNG plants that are also under construction or are being planned between 2023 and 2050. Further, to assess the cost competitiveness of the various LNG projects more accurately, we chose only North American LNG facilities with sufficient economic data to enable such a comparison. We compared the cost competitiveness of LNG coming from these other North American projects with LNG coming from Canada that is intended to be delivered to markets in Asia and Europe.
1. Rystad Energy is an independent energy research company providing data, analytics, and consultancy services to clients around the globe. Its Gas and LNG Markets Solution provides an overview of LNG markets worldwide. The Solution covers the entire value chain associated with gas and LNG production, country and sector-level demand, and LNG trade flows, infrastructure, economics, costs, and contracts through 2050. It allows for the evaluation of the entire LNG market infrastructure, including future planned projects, as well as the benchmarking of costs for LNG projects (Rystad Energy, 2024).
Comparison of LNG project FOB cost break-even (full cycle)
Figure 3 provides a comparison of the free-on-board (FOB) cost break-even for LNG facilities under construction or being planned in North America. FOB break-even costs include upstream and midstream costs for LNG excluding transportation costs (shipping) as seen from the current year. Break-even prices assume a discount rate of 10 percent and represent the point at which the net present value for an LNG project over a 20- to 30-year period becomes positive, including the payment of capital and operating costs, inclusive of taxes.
Among the selected group of North American LNG projects are Canadian LNG projects with an FOB break-even at the lower end of the range (US$7.18 per thousand cubic feet (kcf)) to those at the higher end (US$8.64 per thousand cubic feet (kcf)).
LNG projects in the United States tend to settle in the middle of the pack, with FOB break-even between US$6.44 per kcf and US$8.37 per kcf.
Mexico LNG projects have the widest variation in costs among the selected group of projects, ranging from US$6.94 per kcf to US$9.44 per kcf (see Figure 3).

Source: Derived from Rystad Energy, Gas and LNG Markets Solution.
Total costs by project for LNG delivery to Asia and Europe
The total cost by LNG plant includes FOB cost break-even, transportation costs, and the regasification tariff. Figure 4 compares total project costs for LNG destined for Asia from selected North American LNG facilities.
Canadian LNG projects are very cost competitive, and those with Asia as their intended market tend to cluster at the lower end of the scale. The costs vary by project, but range between US$8.10 per kcf and US$9.56 per kcf, making Canadian LNG projects among the lowest cost projects in North America.
The costs for Mexico’s LNG projects with Asia as the intended destination for their product tend to cluster in the middle of the pack. Costs among U.S. LNG facilities that plan to send their product to Asia tend to sit at the higher end of the scale, at between US$8.90 and US$10.80 per kcf.

Source: Derived from Rystad Energy, Gas and LNG Markets Solution.
Figure 5 compares total project costs for LNG to be delivered to Europe from select North American LNG facilities.
Costs from U.S. LNG facilities show the widest variation for this market at between US$7.48 per kcf and US$9.42 per kcf, but the majority of U.S. LNG facilities tend to cluster at the lower end of the cost scale, between US$7.48 per kcf and US$8.61 per kcf (see Figure 5).
Canadian projects that intend to deliver LNG to Europe show a variety of costs that tend to cluster at the middle to higher end of the spectrum, ranging from US$9.60 per kcf to and US$11.06 per kcf.
The costs of Mexico’s projects that are aimed at delivering LNG to Europe tend to cluster in the middle of the spectrum (US$9.11 per kcf to US$10.61 per kcf).

Source: Derived from Rystad Energy, Gas and LNG Markets Solution.
Conclusion
LNG markets are complex. Each project is unique and presents its own challenges. The future of Canadian LNG projects depends upon the overall demand and supply in the global LNG market. As the demand for LNG increases in the next decades, the world will be searching for energy security.
The lower liquefaction and shipping costs coupled with the lower cost of the natural gas itself in Western Canada translate into lower prices for Canadian LNG, particularly that destined for Asian markets. Those advantages will help make Canadian LNG very competitive and attractive to markets worldwide.
From the Canadian Energy Centre
By Cody Ciona
‘Alberta has never seen this level and volume of load connection requests’
Billions of investment in new data centres is still expected in Alberta despite the province’s electric system operator placing a temporary limit on new large-load grid connections, said Carson Kearl, lead data centre analyst for Enverus Intelligence Research.
Kearl cited NVIDIA CEO Jensen Huang’s estimate from earlier this year that building a one-gigawatt data centre costs between US$60 billion and US$80 billion.
That implies the Alberta Electric System Operator (AESO)’s 1.2 gigawatt temporary limit would still allow for up to C$130 billion of investment.
“It’s got the potential to be extremely impactful to the Alberta power sector and economy,” Kearl said.
Importantly, data centre operators can potentially get around the temporary limit by ‘bringing their own power’ rather than drawing electricity from the existing grid.
In Alberta’s deregulated electricity market – the only one in Canada – large energy consumers like data centres can build the power supply they need by entering project agreements directly with electricity producers.
According to the AESO, there are 30 proposed data centre projects across the province.
The total requested power load for these projects is more than 16 gigawatts, roughly four gigawatts more than Alberta’s demand record in January 2024 during a severe cold snap.
For comparison, Edmonton’s load is around 1.4 gigawatts, the AESO said.
“Alberta has never seen this level and volume of load connection requests,” CEO Aaron Engen said in a statement.
“Because connecting all large loads seeking access would impair grid reliability, we established a limit that preserves system integrity while enabling timely data centre development in Alberta.”
As data centre projects come to the province, so do jobs and other economic benefits.
“You have all of the construction staff associated; electricians, engineers, plumbers, and HVAC people for all the cooling tech that are continuously working on a multi-year time horizon. In the construction phase there’s a lot of spend, and that is just generally good for the ecosystem,” said Kearl.
Investment in local power infrastructure also has long-term job implications for maintenance and upgrades, he said.
“Alberta is a really exciting place when it comes to building data centers,” said Beacon AI CEO Josh Schertzer on a recent ARC Energy Ideas podcast.
“It has really great access to natural gas, it does have some excess grid capacity that can be used in the short term, it’s got a great workforce, and it’s very business-friendly.”
The unaltered reproduction of this content is free of charge with attribution to the Canadian Energy Centre.
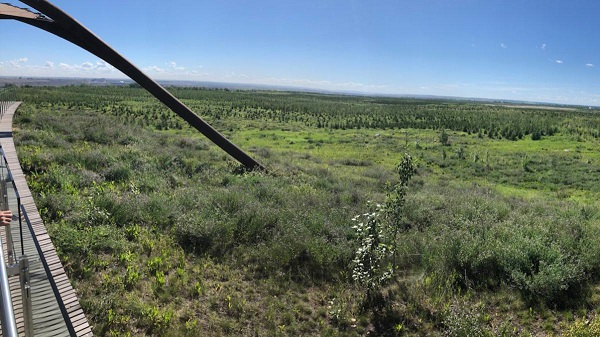
Wapisiw Lookout, reclaimed site of the oil sands industry’s first tailings pond, which started in 1967. The area was restored to a solid surface in 2010 and now functions as a 220-acre watershed. Photo courtesy Suncor Energy
From the Canadian Energy Centre
By CEC Research
Mines demonstrate significant strides through technological innovation
Tailings are a byproduct of mining operations around the world.
In Alberta’s oil sands, tailings are a fluid mixture of water, sand, silt, clay and residual bitumen generated during the extraction process.
Engineered basins or “tailings ponds” store the material and help oil sands mining projects recycle water, reducing the amount withdrawn from the Athabasca River.
In 2023, 79 per cent of the water used for oil sands mining was recycled, according to the latest data from the Alberta Energy Regulator (AER).
Decades of operations, rising production and federal regulations prohibiting the release of process-affected water have contributed to a significant accumulation of oil sands fluid tailings.
The Mining Association of Canada describes that:
“Like many other industrial processes, the oil sands mining process requires water.
However, while many other types of mines in Canada like copper, nickel, gold, iron ore and diamond mines are allowed to release water (effluent) to an aquatic environment provided that it meets stringent regulatory requirements, there are no such regulations for oil sands mines.
Instead, these mines have had to retain most of the water used in their processes, and significant amounts of accumulated precipitation, since the mines began operating.”
Despite this ongoing challenge, oil sands mining operators have made significant strides in reducing fluid tailings through technological innovation.
This is demonstrated by reductions in “legacy fluid tailings” since 2015.
Legacy Fluid Tailings vs. New Fluid Tailings
As part of implementing the Tailings Management Framework introduced in March 2015, the AER released Directive 085: Fluid Tailings Management for Oil Sands Mining Projects in July 2016.
Directive 085 introduced new criteria for the measurement and closure of “legacy fluid tailings” separate from those applied to “new fluid tailings.”
Legacy fluid tailings are defined as those deposited in storage before January 1, 2015, while new fluid tailings are those deposited in storage after January 1, 2015.
The new rules specified that new fluid tailings must be ready to reclaim ten years after the end of a mine’s life, while legacy fluid tailings must be ready to reclaim by the end of a mine’s life.
Total Oil Sands Legacy Fluid Tailings

Alberta’s oil sands mining sector decreased total legacy fluid tailings by approximately 40 per cent between 2015 and 2024, according to the latest company reporting to the AER.
Total legacy fluid tailings in 2024 were approximately 623 million cubic metres, down from about one billion cubic metres in 2015.
The reductions are led by the sector’s longest-running projects: Suncor Energy’s Base Mine (opened in 1967), Syncrude’s Mildred Lake Mine (opened in 1978), and Syncrude’s Aurora North Mine (opened in 2001). All are now operated by Suncor Energy.
The Horizon Mine, operated by Canadian Natural Resources (opened in 2009) also reports a significant reduction in legacy fluid tailings.
The Muskeg River Mine (opened in 2002) and Jackpine Mine (opened in 2010) had modest changes in legacy fluid tailings over the period. Both are now operated by Canadian Natural Resources.
Imperial Oil’s Kearl Mine (opened in 2013) and Suncor Energy’s Fort Hills Mine (opened in 2018) have no reported legacy fluid tailings.
Suncor Energy Base Mine

Between 2015 and 2024, Suncor Energy’s Base Mine reduced legacy fluid tailings by approximately 98 per cent, from 293 million cubic metres to 6 million cubic metres.
Syncrude Mildred Lake Mine

Between 2015 and 2024, Syncrude’s Mildred Lake Mine reduced legacy fluid tailings by approximately 15 per cent, from 457 million cubic metres to 389 million cubic metres.
Syncrude Aurora North Mine

Between 2015 and 2024, Syncrude’s Aurora North Mine reduced legacy fluid tailings by approximately 25 per cent, from 102 million cubic metres to 77 million cubic metres.
Canadian Natural Resources Horizon Mine

Between 2015 and 2024, Canadian Natural Resources’ Horizon Mine reduced legacy fluid tailings by approximately 36 per cent, from 66 million cubic metres to 42 million cubic metres.
Total Oil Sands Fluid Tailings
Reducing legacy fluid tailings has helped slow the overall growth of fluid tailings across the oil sands sector.
Without efforts to reduce legacy fluid tailings, the total oil sands fluid tailings footprint today would be approximately 1.6 billion cubic metres.
The current fluid tailings volume stands at approximately 1.2 billion cubic metres, up from roughly 1.1 billion in 2015.

The unaltered reproduction of this content is free of charge with attribution to the Canadian Energy Centre.

Most Canadians say retaliatory tariffs on American goods contribute to raising the price of essential goods at home
Women and girls beauty pageant urges dismissal of transgender human rights complaint

Mark Carney’s Fiscal Fantasy Will Bankrupt Canada
Sweeping Boston Indictment Points to Vast Chinese Narco-Smuggling and Illegal Alien Labor Plot via Mexican Border
-
Business1 day ago
Mark Carney’s Fiscal Fantasy Will Bankrupt Canada
-
 Opinion1 day ago
Charity Campaigns vs. Charity Donations
-
 Alberta1 day ago
Temporary Alberta grid limit unlikely to dampen data centre investment, analyst says
-
 Frontier Centre for Public Policy2 days ago
Canada’s New Border Bill Spies On You, Not The Bad Guys
-
 Daily Caller20 hours ago
‘Strange Confluence Of Variables’: Mike Benz Wants Transparency Task Force To Investigate What Happened in Butler, PA
-
 Uncategorized2 days ago
CNN’s Shock Climate Polling Data Reinforces Trump’s Energy Agenda
-
 Opinion1 day ago
Preston Manning: Three Wise Men from the East, Again
-
 COVID-191 day ago
Trump DOJ dismisses charges against doctor who issued fake COVID passports