Canadian Energy Centre
Terra Nova back producing oil, benefits to flow for Atlantic Canada communities and world energy security
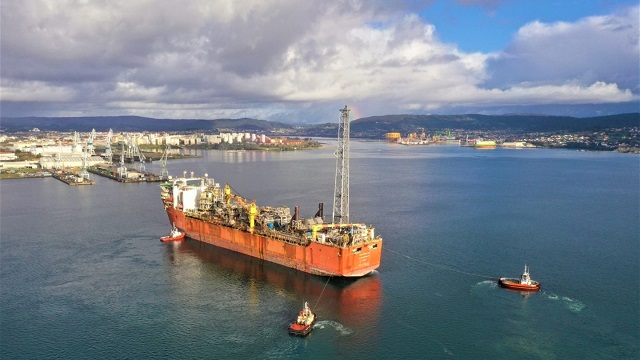
The Terra Nova floating production, storage and offloading (FPSO) vessel. Photo courtesy Suncor Energy
From the Canadian Energy Centre
By Will Gibson
‘You should see it start to make a real impact on the market by 2025’
The Terra Nova offshore oil project sits about 350 kilometres southeast of St. John’s in the deep blue waters of the Atlantic.
And even though St. John’s Mayor Danny Breen can’t see the field and its massive floating, production, storage and offloading (FPSO) vessel from his office at city hall, he’s pleased it’s back to producing oil.
“There’s lots of numbers you could use to demonstrate Terra Nova’s contribution to our province and community, from the royalties and taxes it generates for governments or the jobs and contracts it provides to people and businesses,” says Breen.
“But it’s important for our psyche to see the FPSO back in production. To see it come back after some delays is great news for the province and the offshore industry.”

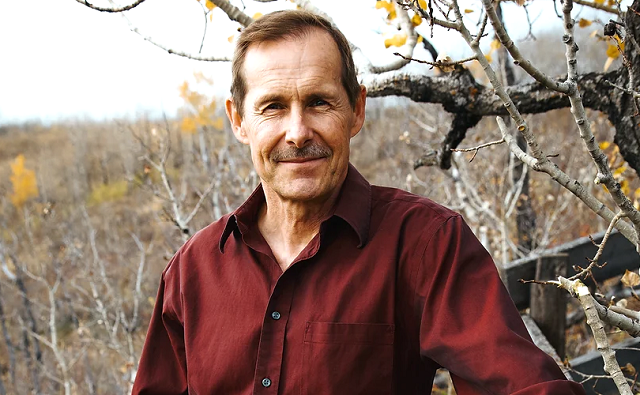
St. John’s Mayor Danny Breen. Photo supplied to Canadian Energy Centre
Suncor Energy CEO Rich Kruger announced in late November that Terra Nova’s FPSO vessel had restarted production after undergoing an extensive makeover in Spain to improve reliability and extend its life.
The massive vessel — standing 18 stories high and three football fields long — first started operating in 2002 and has produced more than 425 million barrels of oil, or enough to meet world oil demand at current levels for just over four years.
While the FPSO was in Spain, additional subsea work took place in the middle of the Atlantic to extend the Terra Nova field’s life, including replacing two million kilograms of mooring chain that anchors the ship to the underwater drilling system.
The project is forecast to extend the life of the Terra Nova project by 10 years and produce an additional 70 million barrels.
Phil Skolnick, Eight Capital’s managing director of research, sees Europe and Asia as potential destinations for those barrels when the project ramps up to full production.
Asian oil demand is rising, and Europe is now taking higher volumes of oil imports from countries other than Russia, its primary supplier before the start of the war in Ukraine.
“You should see it start to make a real impact on the market by 2025, when Terra Nova is expected to get back to producing 180,000 barrels per day,” he says.
“It will have a big impact for the Newfoundland economy.”
Even when the FPSO was in drydock in Spain, Terra Nova continued to provide benefits to the community at home.
In the third quarter of 2023, the latest period available, the project reported it spent $173.8 million in operational and capital expenditures.
This included $52.2 million in procuring goods and services, with 62 per cent spent with suppliers in the province and 94 per cent with Canadian vendors.
Terra Nova provides 710 direct jobs with 90 per cent of its workforce residing in Newfoundland and Labrador. The project is a partnership operated by Suncor, which holds a 48 per cent stake. The other partners are Cenovus Energy (34 per cent) and Murphy Oil (18 per cent).
While wind, hydrogen and other energy projects have been proposed in Newfoundland and Labrador, Breen sees the offshore oil industry as a crucial part of the province’s economy now and in the future.
He believes Terra Nova and the other three producing oil fields in the province — Hibernia, Hebron and White Rose — will assume added importance for the local economy and global energy security.
“Oil is going to be around for a long time, even if demand decreases, because it is an essential part of so many products we use today. And that’s important for us because the offshore industry supports many families across Newfoundland and Labrador today,” Breen says.
“The industry has been under a lot of scrutiny and has faced a lot of challenges, particularly in the approval for new projects. Keeping the production from approved supplies is going to be vital. That’s why it’s good to see the investment in Terra Nova and the return to production. That bodes well for the future.”
Alberta
Game changer: Trans Mountain pipeline expansion complete and starting to flow Canada’s oil to the world
Workers complete the “golden weld” of the Trans Mountain pipeline expansion on April 11, 2024 in the Fraser Valley between Hope and Chilliwack, B.C. The project saw mechanical completion on April 30, 2024. Photo courtesy Trans Mountain Corporation
From the Canadian Energy Centre
By Will Gibson
‘We’re going to be moving into a market where buyers are going to be competing to buy Canadian oil’
It is a game changer for Canada that will have ripple effects around the world.
The Trans Mountain pipeline expansion is now complete. And for the first time, global customers can access large volumes of Canadian oil, with the benefits flowing to Canada’s economy and Indigenous communities.
“We’re going to be moving into a market where buyers are going to be competing to buy Canadian oil,” BMO Capital Markets director Randy Ollenberger said recently, adding this is expected to result in a better price for Canadian oil relative to other global benchmarks.
The long-awaited expansion nearly triples capacity on the Trans Mountain system from Edmonton to the West Coast to approximately 890,000 barrels per day. Customers for the first shipments include refiners in China, California and India, according to media reports.
Shippers include all six members of the Pathways Alliance, a group of companies representing 95 per cent of oil sands production that together plan to reduce emissions from operations by 22 megatonnes by 2030 on the way to net zero by 2050.
The first tanker shipment from Trans Mountain’s expanded Westridge Marine Terminal is expected later in May.
 Photo courtesy Trans Mountain Corporation
The new capacity on the Trans Mountain system comes as demand for Canadian oil from markets outside the United States is on the rise.
According to the Canada Energy Regulator, exports to destinations beyond the U.S. have averaged a record 267,000 barrels per day so far this year, up from about 130,000 barrels per day in 2020 and 33,000 barrels per day in 2017.
“Oil demand globally continues to go up,” said Phil Skolnick, New York-based oil market analyst with Eight Capital.
“Both India and China are looking to add millions of barrels a day of refining capacity through 2030.”
In India, refining demand will increase mainly for so-called medium and heavy oil like what is produced in Canada, he said.
“That’s where TMX is the opportunity for Canada, because that’s the route to get to India.”
Led by India and China, oil demand in the Asia-Pacific region is projected to increase from 36 million barrels per day in 2022 to 52 million barrels per day in 2050, according to the U.S. Energy Information Administration.
More oil coming from Canada will shake up markets for similar world oil streams including from Russia, Ecuador, and Iraq, according to analysts with Rystad Energy and Argus Media.
Expanded exports are expected to improve pricing for Canadian heavy oil, which “have been depressed for many years” in part due to pipeline shortages, according to TD Economics.
 Photo courtesy Trans Mountain Corporation
In recent years, the price for oil benchmark Western Canadian Select (WCS) has hovered between $18-$20 lower than West Texas Intermediate (WTI) “to reflect these hurdles,” analyst Marc Ercolao wrote in March.
“That spread should narrow as a result of the Trans Mountain completion,” he wrote.
“Looking forward, WCS prices could conservatively close the spread by $3–4/barrel later this year, which will incentivize production and support industry profitability.”
Canada’s Parliamentary Budget Office has said that an increase of US$5 per barrel for Canadian heavy oil would add $6 billion to Canada’s economy over the course of one year.
The Trans Mountain Expansion will leave a lasting economic legacy, according to an impact assessment conducted by Ernst & Young in March 2023.
In addition to $4.9 billion in contracts with Indigenous businesses during construction, the project leaves behind more than $650 million in benefit agreements and $1.2 billion in skills training with Indigenous communities.
Ernst & Young found that between 2024 and 2043, the expanded Trans Mountain system will pay $3.7 billion in wages, generate $9.2 billion in GDP, and pay $2.8 billion in government taxes.
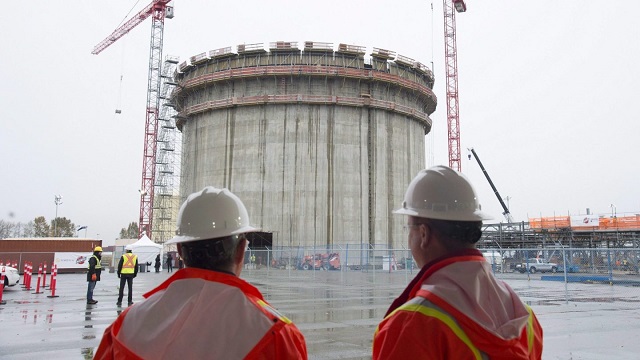
Construction workers look on at the FortisBC Tilbury LNG expansion project in Delta, B.C., Monday, Nov. 16, 2015. CP Images photo
From the Canadian Energy Centre
Lower costs for natural gas, shipping and liquefaction give Canada an edge in the emerging global LNG market
Worldwide concerns about energy security have put a renewed focus on the international liquefied natural gas (LNG) industry. The global demand for LNG is expected to increase over the next few decades.
Global demand growth will be driven primarily by Asian markets where the need for LNG is expected to increase from 277 million tonnes (MT) in 2025 to 509 MT by 2050 (see Figure 1). By 2050 the demand for LNG in Europe will be 83 MT and in Africa 20 MT. In South America too, demand will increase – from 13 MT in 2025 to 31 MT in 2050.

Source: Derived from Rystad Energy, Gas and LNG Markets Solution.
In North America (Canada, Mexico, and United States) a number of LNG projects that are either under construction or in the planning stages will benefit from the rise in global LNG demand.
North American LNG production is expected to grow from 112 MT in 2025 to over 255 MT by 2050 (see Figure 2). In Canada, the LNG projects under construction or in the planning stages include LNG Canada Phases 1 & 2, Woodfibre LNG, Cedar LNG, the Tilbury LNG expansion, and Ksi Lisims LNG. Canada’s LNG production is expected to grow from just 2 MT in 2025 to over 43 MT by 2050. In the United States production is projected to increase from 108 MT in 2025 to 210 MT in 2050.

Source: Derived from Rystad Energy, Gas and LNG Markets Solution.
This CEC Fact Sheet uses Rystad Energy’s Gas and LNG Markets Solution¹ to benchmark the cost competitiveness of LNG projects that are under construction and proposed in Canada compared to other LNG projects under construction and planned elsewhere in North America. (Note that the content of this report does not represent the views of Rystad Energy.)
The LNG cost competitiveness benchmarking analysis used the following performance metrics:
- LNG plant free-on-board (FOB) cost break-even;
- Total LNG plant cost (for delivery into Asia and Europe).
The objective of this LNG cost competitiveness benchmarking is to compare the competitiveness of Canadian LNG projects against those of major competitors in the United States and Mexico. The selection of other North American LNG facilities for the benchmark comparison with Canadian LNG projects (LNG Canada, the Tilbury LNG Expansion, Woodfibre LNG, Cedar LNG, and Ksi Lisims LNG) is based on the rationale that virtually all Canadian LNG plants are under construction or in the planning stage and that they compare well with other North American LNG plants that are also under construction or are being planned between 2023 and 2050. Further, to assess the cost competitiveness of the various LNG projects more accurately, we chose only North American LNG facilities with sufficient economic data to enable such a comparison. We compared the cost competitiveness of LNG coming from these other North American projects with LNG coming from Canada that is intended to be delivered to markets in Asia and Europe.
1. Rystad Energy is an independent energy research company providing data, analytics, and consultancy services to clients around the globe. Its Gas and LNG Markets Solution provides an overview of LNG markets worldwide. The Solution covers the entire value chain associated with gas and LNG production, country and sector-level demand, and LNG trade flows, infrastructure, economics, costs, and contracts through 2050. It allows for the evaluation of the entire LNG market infrastructure, including future planned projects, as well as the benchmarking of costs for LNG projects (Rystad Energy, 2024).
Comparison of LNG project FOB cost break-even (full cycle)
Figure 3 provides a comparison of the free-on-board (FOB) cost break-even for LNG facilities under construction or being planned in North America. FOB break-even costs include upstream and midstream costs for LNG excluding transportation costs (shipping) as seen from the current year. Break-even prices assume a discount rate of 10 percent and represent the point at which the net present value for an LNG project over a 20- to 30-year period becomes positive, including the payment of capital and operating costs, inclusive of taxes.
Among the selected group of North American LNG projects are Canadian LNG projects with an FOB break-even at the lower end of the range (US$7.18 per thousand cubic feet (kcf)) to those at the higher end (US$8.64 per thousand cubic feet (kcf)).
LNG projects in the United States tend to settle in the middle of the pack, with FOB break-even between US$6.44 per kcf and US$8.37 per kcf.
Mexico LNG projects have the widest variation in costs among the selected group of projects, ranging from US$6.94 per kcf to US$9.44 per kcf (see Figure 3).

Source: Derived from Rystad Energy, Gas and LNG Markets Solution.
Total costs by project for LNG delivery to Asia and Europe
The total cost by LNG plant includes FOB cost break-even, transportation costs, and the regasification tariff. Figure 4 compares total project costs for LNG destined for Asia from selected North American LNG facilities.
Canadian LNG projects are very cost competitive, and those with Asia as their intended market tend to cluster at the lower end of the scale. The costs vary by project, but range between US$8.10 per kcf and US$9.56 per kcf, making Canadian LNG projects among the lowest cost projects in North America.
The costs for Mexico’s LNG projects with Asia as the intended destination for their product tend to cluster in the middle of the pack. Costs among U.S. LNG facilities that plan to send their product to Asia tend to sit at the higher end of the scale, at between US$8.90 and US$10.80 per kcf.

Source: Derived from Rystad Energy, Gas and LNG Markets Solution.
Figure 5 compares total project costs for LNG to be delivered to Europe from select North American LNG facilities.
Costs from U.S. LNG facilities show the widest variation for this market at between US$7.48 per kcf and US$9.42 per kcf, but the majority of U.S. LNG facilities tend to cluster at the lower end of the cost scale, between US$7.48 per kcf and US$8.61 per kcf (see Figure 5).
Canadian projects that intend to deliver LNG to Europe show a variety of costs that tend to cluster at the middle to higher end of the spectrum, ranging from US$9.60 per kcf to and US$11.06 per kcf.
The costs of Mexico’s projects that are aimed at delivering LNG to Europe tend to cluster in the middle of the spectrum (US$9.11 per kcf to US$10.61 per kcf).

Source: Derived from Rystad Energy, Gas and LNG Markets Solution.
Conclusion
LNG markets are complex. Each project is unique and presents its own challenges. The future of Canadian LNG projects depends upon the overall demand and supply in the global LNG market. As the demand for LNG increases in the next decades, the world will be searching for energy security.
The lower liquefaction and shipping costs coupled with the lower cost of the natural gas itself in Western Canada translate into lower prices for Canadian LNG, particularly that destined for Asian markets. Those advantages will help make Canadian LNG very competitive and attractive to markets worldwide.

Canadian Christian chiropractor fights ‘illegal’ $65,000 fine for refusing to wear mask

U.S. EPA Unveils Carbon Dioxide Regulations That Could End Coal and Natural Gas Power Generation

The Swamp Survived: Why Trump Failed to “Drain the Swamp”
CBC tries to hide senior executive bonuses

‘Got Played’: Israel Reportedly Suspicious Biden Admin Had Backroom Talks With Mediators Over Ceasefire Deal

COVID Is Over — But Did We Learn Anything From It?

Elon Musk’s X will help fund COVID shot critic’s ongoing legal battle against Canadian university

-
 Brownstone Institute1 day ago
Medical Elites’ Disgrace Over Ivermectin
-
 Bruce Dowbiggin2 days ago
Getting Real About Justin’s Real Estate Economy. It Won’t Last
-
 Energy15 hours ago
Federal government continues to reject golden opportunities to export LNG
-
 Bruce Dowbiggin15 hours ago
Why Do The Same Few Always Get The Best Sports Scoops?
-
 Opinion1 day ago
The American Experiment Has Gone Down In Flames
-
 conflict17 hours ago
‘It Makes No Sense’: Experts Puzzled By Biden Admin’s Claim That Rafah Invasion Wouldn’t Help Israel Defeat Hamas
-
 COVID-1917 hours ago
The New York Times Admits Injuries from COVID-19 Shots
-
 Energy14 hours ago
Buckle Up for Summer Blackouts: Wind Is Already Failing Texas in Spring