National
Medical Assistance in Dying now accounts for over 4% of deaths in Canada
The following are interesting statistics pulled directly from the:
Fourth annual report on Medical Assistance in Dying in Canada 2022
Growth in the number of medically assisted deaths in Canada continues in 2022.
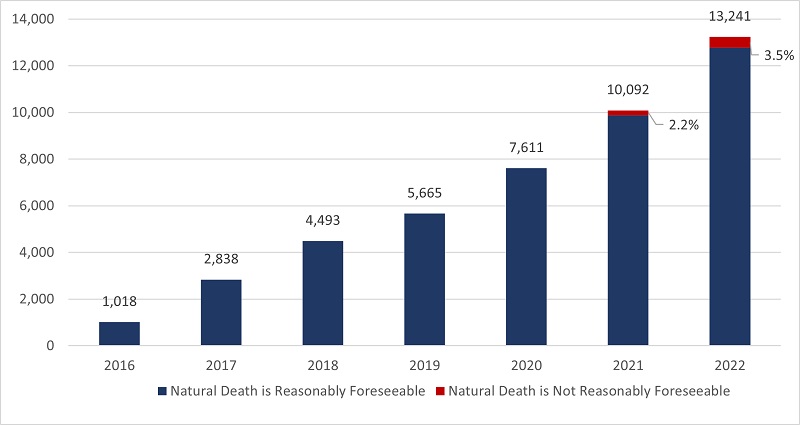
- In 2022, there were 13,241 MAID provisions reported in Canada, accounting for 4.1% of all deaths in Canada.
- The number of cases of MAID in 2022 represents a growth rate of 31.2% over 2021. All provinces except Manitoba and the Yukon continue to experience a steady year-over-year growth in 2022.
- When all data sources are considered, the total number of medically assisted deaths reported in Canada since the introduction of federal MAID legislation in 2016 is 44,958.
Profile of MAID recipients
- In 2022, a slightly larger proportion of males (51.4%) than females (48.6%) received MAID. This result is consistent with 2021 (52.3% males and 47.7% females), 2020 (51.9% males and 48.1% females) and 2019 (50.9% males and 49.1% females).
- The average age of individuals at the time MAID was provided in 2022 was 77.0 years. This average age is slightly higher than the averages of 2019 (75.2), 2020 (75.3) and 2021 (76.3). The average age of females during 2022 was 77.9, compared to males at 76.1.
- Cancer (63.0%) is the most cited underlying medical condition among MAID provisions in 2022, down from 65.6% in 2021 and from a high of 69.1% in 2020. This is followed by cardiovascular conditions (18.8%), other conditions (14.9%), respiratory conditions (13.2%) and neurological conditions (12.6%).
- In 2022, 3.5% of the total number of MAID provisions (463 individuals), were individuals whose natural deaths were not reasonably foreseeable. This is an increase from 2.2% in 2021 (223 individuals). The most cited underlying medical condition for this population was neurological (50.0%), followed by other conditions (37.1%), and multiple comorbidities (23.5%), which is similar to 2021 results. The average age of individuals receiving MAID whose natural death was not reasonably foreseeable was 73.1 years, slightly higher than 70.1 in 2021 but lower than the average age of 77.0 for all MAID recipients in 2022.
Nature of suffering among MAID recipients
- In 2022, the most commonly cited sources of suffering by individuals requesting MAID were the loss of ability to engage in meaningful activities (86.3%), followed by loss of ability to perform activities of daily living (81.9%) and inadequate control of pain, or concern about controlling pain (59.2%).
- These results continue to mirror very similar trends seen in the previous three years (2019 to 2021), indicating that the nature of suffering that leads a person to request MAID has remained consistent over the past four years.
Eligibility Criteria
- Request MAID voluntarily
- 18 years of age or older
- Capacity to make health care decisions
- Must provide informed consent
- Eligible for publicly funded health care services in Canada
- Diagnosed with a “grievous and irremediable medical condition,” where a person must meet all of the following criteria:
- serious and incurable illness, disease or disability
- advanced state of irreversible decline in capability,
- experiencing enduring physical or psychological suffering that is caused by their illness, disease or disability or by the advanced state of decline in capability, that is intolerable to them and that cannot be relieved under conditions that they consider acceptable
- Mental Illness as sole underlying medical condition is excluded until March 17, 2024
3.1 Number of Reported MAID Deaths in Canada (2016 to 2022)
2022 marks six and a half years of access to MAID in Canada. In 2022, there were 13,241 MAID provisions in Canada, bringing the total number of medically assisted deaths in Canada since 2016 to 44,958. In 2022, the total number of MAID provisions increased by 31.2% (2022 over 2021) compared to 32.6% (2021 over 2020). The annual growth rate in MAID provisions has been steady over the past six years, with an average growth rate of 31.1% from 2019 to 2022.

Access to MAID for individuals whose deaths were not reasonably foreseeable marked its second year of eligibility in 2022. In Canada, eligibility for individuals whose death is not reasonably foreseeable began on March 17, 2021, after the passage of the new legislation.Footnote8 There were 463 MAID provisions for persons whose natural death was not reasonably foreseeable, representing 3.5% of all MAID deaths in 2022. This is just over twice the total number of provisions for individuals where natural death was not reasonably foreseeable in 2021 (223 provisions representing 2.2% of all MAID provisions in 2021). Table 3.1 represents total MAID provisions in Canada from 2016 to 2022, including provisions for individuals where natural death was not reasonably foreseeable.
All jurisdictions, except Manitoba and Yukon, experienced growth in MAID provisions in 2022. The highest percentage year over year increases occurred in Québec (45.5%), Alberta (40.7%), Newfoundland and Labrador (38.5%), Ontario (26.8%) and British Columbia (23.9%). Nova Scotia (11.8%), Prince Edward Island (7.3%) and Saskatchewan (4.0%) had lower growth rates. The Yukon remained at the same level as 2021, while Manitoba was the only jurisdiction to experience a decline in MAID provisions for 2022 (-9.0%).
| MAID | NL | PE | NS | NB | QC | ON | MB | SK | AB | BC | YT | NT | NU | Canada |
|---|---|---|---|---|---|---|---|---|---|---|---|---|---|---|
| 2016 | – | – | 24 | 9 | 494 | 191 | 24 | 11 | 63 | 194 | – | – | – | 1,018 |
| 2017 | – | – | 62 | 49 | 853 | 839 | 63 | 57 | 205 | 677 | – | – | – | 2,838 |
| 2018 | 23 | 8 | 126 | 92 | 1,249 | 1,500 | 138 | 85 | 307 | 951 | 12 | – | – | 4,493 |
| 2019 | 20 | 20 | 147 | 141 | 1,604 | 1,788 | 177 | 97 | 377 | 1,280 | 13 | – | – | 5,665 |
| 2020 | 49 | 37 | 190 | 160 | 2,278 | 2,378 | 214 | 160 | 555 | 1,572 | 13 | – | – | 7,611 |
| 2021 | 65 | 41 | 245 | 205 | 3,299 | 3,102 | 245 | 247 | 594 | 2,030 | 16 | – | – | 10,092 |
| 2022 | 90 | 44 | 274 | 247 | 4,801 | 3,934 | 223 | 257 | 836 | 2,515 | 16 | – | – | 13,241 |
| TOTAL 2016-2022 |
267 | 156 | 1,068 | 903 | 14,578 | 13,732 | 1,084 | 914 | 2,937 | 9,219 | 84 | – | – | 44,958 |
3.2 MAID Deaths as a Proportion of Total Deaths in Canada
MAID deaths accounted for 4.1% of all deaths in Canada in 2022, an increase from 3.3% in 2021, 2.5% in 2020 and 2.0% in 2019. In 2022, six jurisdictions continue to experience increases in the number of MAID provisions as a percentage of total deaths, ranging from a low of 1.5% (Newfoundland & Labrador) to a high of 6.6% (Québec). MAID deaths as a percentage of total deaths remained at the same levels as 2021 for Prince Edward Island, Nova Scotia, and Saskatchewan, while Manitoba experienced a decline in MAID deaths as a percentage of all deaths (from 2.1% in 2021 to 1.8% in 2022). As with each of the three previous years (2019 to 2021), Québec and British Columbia experienced the highest percentage of MAID deaths as a proportion of all deaths within their jurisdiction in 2022 (6.6% and 5.5% respectively), continuing to reflect the socio-political dynamics of these two jurisdictions in the context of MAID.
4.5 Profile of Persons Receiving MAID Whose Natural Death is not Reasonably Foreseeable
2022 marks the second year that MAID for persons whose natural death is not reasonably foreseeable is permitted under the law if all other eligibility criteria are met (Table 1.1). New federal MAID legislation passed on March 17, 2021, created a two-track approach to procedural safeguards for MAID practitioners to follow, based on whether or not a person’s natural death is reasonably foreseeable. This approach to safeguards ensures that sufficient time and expertise are spent assessing MAID requests from persons whose natural death is not reasonably foreseeable. New and enhanced safeguards (Table 1.2), including a minimum 90-day assessment period, seek to address the diverse source of suffering and vulnerability that could potentially lead a person who is not nearing death to ask for MAID and to identify alternatives to MAID that could reduce suffering.
In 2022, 3.5% of MAID recipients (463 individuals) were assessed as not having a reasonably foreseeable natural death, up slightly from 2.2% (223 individuals) in 2021. As a percentage of all MAID deaths in Canada, MAID for individuals whose natural death is not reasonably foreseeable represents just 0.14% of all deaths in Canada in 2022 (compared to all MAID provisions, which represent 4.1% of all 2022 deaths in Canada). The proportion of MAID recipients whose natural death was not reasonably foreseeable continues to remain very small compared to the total number of MAID recipients.
This population of individuals whose natural death was not reasonably foreseeable have a different medical profile than individuals whose death was reasonably foreseeable. As shown in Chart 4.5A, the main underlying medical condition reported in the population whose natural death was not reasonably foreseeable was neurological (50.0%), followed by ‘other condition’ (37.1%), and multiple comorbidities (23.5%). This differs from the main condition (as reported in Chart 4.1A) for all MAID recipients in 2022, where the majority of persons receiving MAID had cancer as a main underlying medical condition (63.0%), followed by cardiovascular conditions (18.8%) and other conditions (14.9%) (such as chronic pain, osteoarthritis, frailty, fibromyalgia, autoimmune conditions). These results are similar to 2021.

Of the MAID provisions for individuals where death was reasonably foreseeable, the majority were individuals ages 71 and older (71.1%) while only 28.9% were between ages 18-70. A similar trend was observed for individuals where natural death was not reasonably foreseeable which also showed a greater percentage of individuals who received MAID being 71 and older (58.5%) and a lower number of MAID provisions for individuals between 18-70 years (41.5%). Overall, however, MAID provisions for individuals whose death is not reasonably foreseeable tended to be in the younger age categories than those where natural death is foreseeable.

Business
Most Canadians say retaliatory tariffs on American goods contribute to raising the price of essential goods at home

![]()
- 77 per cent say Canada’s tariffs on U.S. products increase the price of consumer goods
- 72 per cent say that their current tax bill hurts their standard of living
A new MEI-Ipsos poll published this morning reveals a clear disconnect between Ottawa’s high-tax, high-spending approach and Canadians’ level of satisfaction.
“Canadians are not on board with Ottawa’s fiscal path,” says Samantha Dagres, communications manager at the MEI. “From housing to trade policy, Canadians feel they’re being squeezed by a government that is increasingly an impediment to their standard of living.”
More than half of Canadians (54 per cent) say Ottawa is spending too much, while only six per cent think it is spending too little.
A majority (54 per cent) also do not believe federal dollars are being effectively allocated to address Canada’s most important issues, and a similar proportion (55 per cent) are dissatisfied with the transparency and accountability in the government’s spending practices.
As for their own tax bills, Canadians are equally skeptical. Two-thirds (67 per cent) say they pay too much income tax, and about half say they do not receive good value in return.
Provincial governments fared even worse. A majority of Canadians say they receive poor value for the taxes they pay provincially. In Quebec, nearly two-thirds (64 per cent) of respondents say they are not getting their money’s worth from the provincial government.
Not coincidentally, Quebecers face the highest marginal tax rates in North America.
On the question of Canada’s response to the U.S. trade dispute, nearly eight in 10 Canadians (77 per cent) agree that Ottawa’s retaliatory tariffs on American products are driving up the cost of everyday goods.
“Canadians understand that tariffs are just another form of taxation, and that they are the ones footing the bill for any political posturing,” adds Ms. Dagres. “Ottawa should favour unilateral tariff reduction and increased trade with other nations, as opposed to retaliatory tariffs that heap more costs onto Canadian consumers and businesses.”
On the issue of housing, 74 per cent of respondents believe that taxes on new construction contribute directly to unaffordability.
All of this dissatisfaction culminates in 72 per cent of Canadians saying their overall tax burden is reducing their standard of living.
“Taxpayers are not just ATMs for government – and if they are going to pay such exorbitant taxes, you’d think the least they could expect is good service in return,” says Ms. Dagres. “Canadians are increasingly distrustful of a government that believes every problem can be solved with higher taxes.”
A sample of 1,020 Canadians 18 years of age and older was polled between June 17 and 23, 2025. The results are accurate to within ± 3.8 percentage points, 19 times out of 20.
The results of the MEI-Ipsos poll are available here.
* * *
The MEI is an independent public policy think tank with offices in Montreal, Ottawa, and Calgary. Through its publications, media appearances, and advisory services to policymakers, the MEI stimulates public policy debate and reforms based on sound economics and entrepreneurship.

From the Fraser Institute
By Julio Mejía and Elmira Aliakbari
At the federal level, the Carney government should scrap several Trudeau-era policies including Bill C-69 (which introduced vague criteria into energy project assessments including the effects on the “intersection of sex and gender with other identity factors”)
The Eby government has left the door (slightly) open to Alberta’s proposed pipeline to the British Columbia’s northern coast. Premier David Eby said he isn’t opposed to a new pipeline that would expand access to Asian markets—but he does not want government to pay for it. That’s a fair condition. But to attract private investment for pipelines and other projects, both the Eby government and the Carney government must reform the regulatory environment.
First, some background.
Trump’s tariffs against Canadian products underscore the risks of heavily relying on the United States as the primary destination for our oil and gas—Canada’s main exports. In 2024, nearly 96 per cent of oil exports and virtually all natural gas exports went to our southern neighbour. Clearly, Canada must diversify our energy export markets. Expanded pipelines to transport oil and gas, mostly produced in the Prairies, to coastal terminals would allow Canada’s energy sector to find new customers in Asia and Europe and become less reliant on the U.S. In fact, following the completion of the Trans Mountain Pipeline expansion between Alberta and B.C. in May 2024, exports to non-U.S. destinations increased by almost 60 per cent.
However, Canada’s uncompetitive regulatory environment continues to create uncertainty and deter investment in the energy sector. According to a 2023 survey of oil and gas investors, 68 per cent of respondents said uncertainty over environmental regulations deters investment in Canada compared to only 41 per cent of respondents for the U.S. And 59 per cent said the cost of regulatory compliance deters investment compared to 42 per cent in the U.S.
When looking at B.C. specifically, investor perceptions are even worse. Nearly 93 per cent of respondents for the province said uncertainty over environmental regulations deters investment while 92 per cent of respondents said uncertainty over protected lands deters investment. Among all Canadian jurisdictions included in the survey, investors said B.C. has the greatest barriers to investment.
How can policymakers help make B.C. more attractive to investment?
At the federal level, the Carney government should scrap several Trudeau-era policies including Bill C-69 (which introduced vague criteria into energy project assessments including the effects on the “intersection of sex and gender with other identity factors”), Bill C-48 (which effectively banned large oil tankers off B.C.’s northern coast, limiting access to Asian markets), and the proposed cap on greenhouse gas (GHG) emissions in the oil and gas sector (which will likely lead to a reduction in oil and gas production, decreasing the need for new infrastructure and, in turn, deterring investment in the energy sector).
At the provincial level, the Eby government should abandon its latest GHG reduction targets, which discourage investment in the energy sector. Indeed, in 2023 provincial regulators rejected a proposal from FortisBC, the province’s main natural gas provider, because it did not align with the Eby government’s emission-reduction targets.
Premier Eby is right—private investment should develop energy infrastructure. But to attract that investment, the province must have clear, predictable and competitive regulations, which balance environmental protection with the need for investment, jobs and widespread prosperity. To make B.C. and Canada a more appealing destination for investment, both federal and provincial governments must remove the regulatory barriers that keep capital away.

Julio Mejía

Elmira Aliakbari

Dallas mayor invites NYers to first ‘sanctuary city from socialism’
Canada’s Carbon Tax Is A Disaster For Our Economy And Oil Industry

The Left Thinks Drug Criminalization Is Racist. Minorities Disagree

Trump’s One Big Beautiful Bill Resets The Energy Policy Playing Field

Texas flood kills 43 including children at Christian camp

The Digital Services Tax Q&A: “It was going to be complicated and messy”
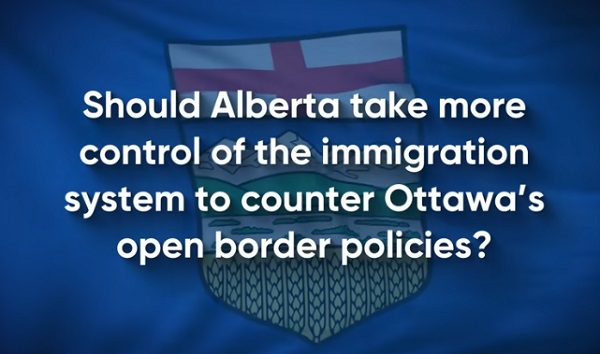
Alberta Next: Immigration
-
 Business2 days ago
Carney government should recognize that private sector drives Canada’s economy
-
 Alberta2 days ago
Alberta school boards required to meet new standards for school library materials with regard to sexual content
-
 Environment1 day ago
EPA releases report on chemtrails, climate manipulation
-
 Bruce Dowbiggin2 days ago
The Covid 19 Disaster: When Do We Get The Apologies?
-
 Alberta2 days ago
Fourteen regional advisory councils will shape health care planning and delivery in Alberta
-
 Media2 days ago
CBC journalist quits, accuses outlet of anti-Conservative bias and censorship
-
 Crime1 day ago
Sweeping Boston Indictment Points to Vast Chinese Narco-Smuggling and Illegal Alien Labor Plot via Mexican Border
-
 Business1 day ago
CBC six-figure salaries soar