Fraser Institute
Federal government cranked up spending up but Canadians are worse off


From the Fraser Institute
By Matthew Lau

“If spending money like water was the answer to our country’s problems,” Margaret Thatcher said in 1980, less than two years after the United Kingdom’s Winter of Discontent, “we would have no problems now. If ever a nation has spent, spent, spent, and spent again, ours has.” That a government cannot spend away the country’s problems is a clear lesson of history. The Trudeau government evidently has not learned this—it has spent, spent and spent more, and the country’s problems have gotten worse.
In 2014-15, before the Liberals took office, federal program spending was 12.8 per cent of GDP (the value of final goods and services produced in Canada). In 2023-24, it’s projected at 15.7 per cent. And relative to 2014-15, annual program spending is $89 billion higher than if it had tracked with overall economic growth.
As Thatcher would have predicted, this extra spending has not solved most problems. Consider health care. The Fraser Institute’s survey of health-care specialists found a median wait time of 27.7 weeks between referral from a general practitioner and receipt of treatment in 2023—a 51 per cent increase versus the 18.3 weeks in 2015. Relative to peer countries, Canada is a big health-care spender but with poor results, and is far below average on key metrics such as physicians and hospital beds per capita.
Another big spending area is climate change. The Liberals boast of pouring more than $120 billion into climate programs, but even with an annually increasing carbon tax and onerous regulation on top of that spending, the government is on track to miss its 2030 climate targets. Given the high cost of its climate policies relative to environmental benefits, that’s not a bad thing. Ottawa’s climate targets are wildly unrealistic, and achieving them would mean devastating the economy further.
Speaking of devasting the economy, when the Trudeau government spends, it claims it will support economic growth, increase affordability or otherwise deliver financial benefits. Eight years in, these benefits have not materialized. As of the third quarter of 2023, after five consecutive quarters of declining real GDP per capita, Canada’s cumulative growth in the past eight years is a paltry 1.6 per cent versus 14.7 per cent in the United States. One way to think about this gap: if Canada’s real GDP per-capita growth tracked with the U.S. since the Liberals took office, Canadian living standards would be about 12.8 per cent higher than they are today.
Finally, the Trudeau government has significantly ramped up child-care spending, but the effect of the national child-care program has been to severely distort and in many cases destroy the child-care sector by applying a discriminatory funding model that pushes child-care entrepreneurs out of the market and discourages private investment. The federal program is composed of separate agreements with the provinces, but with the child-care sector suffering crisis and widespread shortages from coast to coast, it’s reasonable to conclude Ottawa’s plan is fatally flawed.
Wherever you look, the pattern is the same—federal spending is up, but outcomes are worse. The government creates problems and does not solve them when it spends money like water. Margaret Thatcher well understood this fact. Justin Trudeau, unfortunately, evidently does not.
Author:


From the Fraser Institute
The dawn of a new year is an opportune time to ponder the recent performance of Canada’s $3.4 trillion economy. And the overall picture is not exactly cheerful.
Since the start of 2025, our principal trading partner has been ruled by a president who seems determined to unravel the post-war global economic and security order that provided a stable and reassuring backdrop for smaller countries such as Canada. Whether the Canada-U.S.-Mexico trade agreement (that President Trump himself pushed for) will even survive is unclear, underscoring the uncertainty that continues to weigh on business investment in Canada.
At the same time, Europe—representing one-fifth of the global economy—remains sluggish, thanks to Russia’s relentless war of choice against Ukraine, high energy costs across much of the region, and the bloc’s waning competitiveness. The huge Chinese economy has also lost a step. None of this is good for Canada.
Yet despite a difficult external environment, Canada’s economy has been surprisingly resilient. Gross domestic product (GDP) is projected to grow by 1.7 per cent (after inflation) this year. The main reason is continued gains in consumer spending, which accounts for more than three-fifths of all economic activity. After stripping out inflation, money spent by Canadians on goods and services is set to climb by 2.2 per cent in 2025, matching last year’s pace. Solid consumer spending has helped offset the impact of dwindling exports, sluggish business investment and—since 2023—lacklustre housing markets.
Another reason why we have avoided a sharper economic downturn is that the Trump administration has, so far, exempted most of Canada’s southbound exports from the president’s tariff barrage. This has partially cushioned the decline in Canada’s exports—particularly outside of the steel, aluminum, lumber and auto sectors, where steep U.S. tariffs are in effect. While exports will be lower in 2025 than the year before, the fall is less dramatic than analysts expected 6 to 8 months ago.
Although Canada’s economy grew in 2025, the job market lost steam. Employment growth has softened and the unemployment rate has ticked higher—it’s on track to average almost 7 per cent this year, up from 5.4 per cent two years ago. Unemployment among young people has skyrocketed. With the economy showing little momentum, employment growth will remain muted next year.
Unfortunately, there’s nothing positive to report on the investment front. Adjusted for inflation, private-sector capital spending has been on a downward trajectory for the last decade—a long-term trend that can’t be explained by Trump’s tariffs. Canada has underperformed both the United States and several other advanced economies in the amount of investment per employee. The investment gap with the U.S. has widened steadily since 2014. This means Canadian workers have fewer and less up-to-date tools, equipment and technology to help them produce goods and services compared to their counterparts in the U.S. (and many other countries). As a result, productivity growth in Canada has been lackluster, narrowing the scope for wage increases.
Preliminary data indicate that both overall non-residential investment and business capital spending on machinery, equipment and advanced technology products will be down again in 2025. Getting clarity on the future of the Canada-U.S. trade relationship will be key to improving the business environment for private-sector investment. Tax and regulatory policy changes that make Canada a more attractive choice for companies looking to invest and grow are also necessary. This is where government policymakers should direct their attention in 2026.
From the Fraser Institute
A report published by the Fraser Institute reaffirms just how much more economically free some states are compared with others. These are places where citizens are allowed to make more of their economic choices. Their taxes are lighter, and their regulatory burdens are easier. The benefits for workers, consumers and businesses have been clear for a long time.
There’s another group of states to watch: “movers” that have become much freer in recent decades. These are states that may not be the freest, but they have been cutting taxes and red tape enough to make a big difference.
How do they fare?
I recently explored this question using 22 years of data from the same Economic Freedom of North America index. The index uses 10 variables encompassing government spending, taxation and labour regulation to assess the degree of economic freedom in each of the 50 states.
Some states, such as New Hampshire, have long topped the list. It’s been in the top five for three decades. With little room to grow, the Granite State’s level of economic freedom hasn’t budged much lately. Others, such as Alaska, have significantly improved economic freedom over the last two decades. Because it started so low, it remains relatively unfree at 43rd out of 50.
Three states—North Carolina, North Dakota and Idaho—have managed to markedly increase and rank highly on economic freedom.
In 2000, North Carolina was the 19th most economically free state in the union. Though its labour market was relatively unhindered by the state’s government, its top marginal income tax rate was America’s ninth-highest, and it spent more money than most states.
From 2013 to 2022, North Carolina reduced its top marginal income tax rate from 7.75 per cent to 4.99 per cent, reduced government employment and allowed the minimum wage to fall relative to per-capita income. By 2022, it had the second-freest labour market in the country and was ninth in overall economic freedom.
North Dakota took a similar path, reducing its 5.54 per cent top income tax rate to 2.9 per cent, scaling back government employment, and lowering its minimum wage to better reflect local incomes. It went from the 27th most economically free state in the union in 2000 to the 10th freest by 2022.
Idaho saw the most significant improvement. The Gem State has steadily improved spending, taxing and labour market freedom, allowing it to rise from the 28th most economically free state in 2000 to the eighth freest in 2022.
We can contrast these three states with a group that has achieved equal and opposite distinction: California, Delaware, New Jersey and Maryland have managed to decrease economic freedom and end up among the least free overall.
What was the result?
The economies of the three liberating states have enjoyed almost twice as much economic growth. Controlling for inflation, North Carolina, North Dakota and Idaho grew an average of 41 per cent since 2010. The four repressors grew by just 24 per cent.
Among liberators, statewide personal income grew 47 per cent from 2010 to 2022. Among repressors, it grew just 26 per cent.
In fact, when it comes to income growth per person, increases in economic freedom seem to matter even more than a state’s overall, long-term level of freedom. Meanwhile, when it comes to population growth, placing highly over longer periods of time matters more.
The liberators are not unique. There’s now a large body of international evidence documenting the freedom-prosperity connection. At the state level, high and growing levels of economic freedom go hand-in-hand with higher levels of income, entrepreneurship, in-migration and income mobility. In economically free states, incomes tend to grow faster at the top and bottom of the income ladder.
These states suffer less poverty, homelessness and food insecurity and may even have marginally happier, more philanthropic and more tolerant populations.
In short, liberation works. Repression doesn’t.


Remembering Afghanistan and the sacrifices of our military families

“Magnitude cannot be overstated”: Minnesota aid scam may reach $9 billion

Largest fraud in US history? Independent Journalist visits numerous daycare centres with no children, revealing massive scam
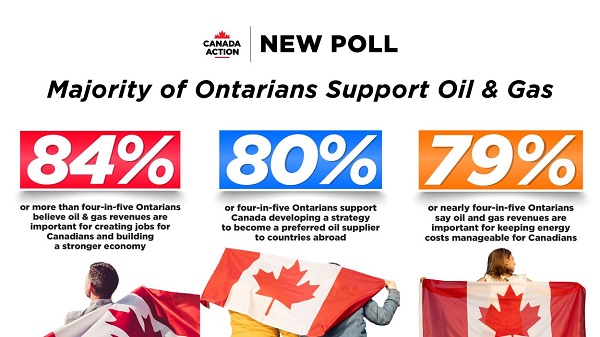
New Poll Shows Ontarians See Oil & Gas as Key to Jobs, Economy, and Trade

How to talk about housing at the holiday dinner table
Socialism vs. Capitalism

Alberta Next Panel calls for less Ottawa—and it could pay off
-
 Alberta1 day ago
The Canadian Energy Centre’s biggest stories of 2025
-
 Bruce Dowbiggin2 days ago
In Contentious Canada Reality Is Still Six Degrees Of Hockey
-
 Business1 day ago
Resurfaced Video Shows How Somali Scammers Used Day Care Centers To Scam State
-
 Business2 days ago
DOOR TO DOOR: Feds descend on Minneapolis day cares tied to massive fraud
-
 Addictions9 hours ago
Coffee, Nicotine, and the Politics of Acceptable Addiction
-
 Business2 days ago
Canada needs serious tax cuts in 2026
-
 Business1 day ago
Ottawa Is Still Dodging The China Interference Threat
-
 Business1 day ago
Minneapolis day care filmed empty suddenly fills with kids