David Clinton
Are We Winning the Patient-to-Doctor Ratio War?


 By
By The fact that millions of Canadians lack primary healthcare providers is a big deal. The grand promise of universal healthcare rings hollow for families forced to spend six hours waiting in a hospital emergency room for a simple ear infection diagnosis.
Just how big a deal is it? Statistics Canada data from 2021 ranks provinces by their ability to provide primary health providers. As you can see from the chart, New Brunswick and Ontario were doing the best, with doctors for nearly 90 percent of their residents. Quebec, able to find providers for just 78.4 percent of their population, landed at the bottom. But even just 10-15 percent without proper coverage is a serious systemic failure.
 |
Since healthcare is administered by the provinces, it makes sense to assume that provincial policies will influence results. So comparing access to primary care practice results over time might help us understand what’s working and what isn’t.
The Audit is a reader-supported publication.
To receive new posts and support my work, consider becoming a free or paid subscriber.
To that end, I pulled Statistics Canada data tracking total employment in offices of physicians (NAICS code 621111) by province. The data covers all employees (including nurses, office managers, and receptionists) in all non-hospital medical offices providing services that don’t include mental health.
I originally searched unsuccessfully for usable data specific to doctors. But as it turns out, such data would have included surgeons and other hospital-based specialties when I’m really looking for general (family) care providers. So I think what we got will actually act as a better proxy for primary care access.
Do keep in mind that staffing levels in the sector represent just one of many statistical signals we could use to understand the healthcare universe. And it’s just a proxy that’s not necessarily a perfect map to reality.
In any case, I adjusted the numbers by provincial populations so they’d make statistical sense. The chart below contains ratios representing how many residents there are per worker between 2010 and 2023:
 |
You might notice that PEI is missing from that chart. That’s because the reported numbers fell below Statistics Canada’s privacy threshold for most of the covered years.
Alberta, with a ratio of just 282:1 is the current champion, while Newfoundland (438:1) has the worst record. But changes over time are where things get interesting. BC’s performance declined by more than 11 percent. And Quebec improved by more than 40 percent!
As you can see for yourself in that chart, Quebec’s most dramatic growth took place between 2016 and 2019. What was going on around that time? Well, both Bill 10 and Bill 20 were introduced in 2015.
- Bill 10 restructured the healthcare system by reducing the number of administrative regions and centralizing governance to streamline services and improve efficiency.
- Bill 20 established patient quotas for doctors, mandating a minimum number of patients they were required to see. Physicians who did not meet these quotas faced penalties, such as reduced compensation.
I don’t need to speak French to assume that those measures must have inspired an awful lot of anger and push back from within the medical profession. But the results speak for themselves.
Or do they? You see there’s something else about Quebec we can’t ignore: Chaoulli v. Quebec (2005). That’s the Supreme Court of Canada case where the Canada Health Act’s ban on private delivery of healthcare was ruled unconstitutional (for Quebec, at any rate).
As a direct result of that decision, there are now more than 50 procedures that can be performed in private surgical clinics in the province. The number of private clinics nearly doubled between 2014 and 2023.
Predictably, wait times for surgeries fell significantly over that time. But the numbers of non-hospital employees would probably have climbed at the same rate. That could possibly go further to explain Quebec’s steady and consistent improvements in our data.
What about the other provinces? There have been structural changes to delivery policies in recent years, but they’re mostly too new to have produced a measurable impact. But here’s a brief overview of what’s being tried:
- This Toronto Star piece describes efforts in both Ontario and BC involving plans among some smaller municipalities to build and manage family health practices and pay their doctors as employees. The idea is that many doctors will prefer to avoid the headaches of starting and running their own businesses and would prefer instead to work for someone else. The obvious goal is to attract new doctors to underserved communities. It’s still way too soon to know whether they’ll be successful in the desperate race for the shrinking pool of family physicians.
- Both Ontario and Alberta have championed Family Health Groups (FHGs), where physicians receive additional incentives for providing comprehensive care. Ontario’s Family Health Networks (FHN) and Family Health Organizations (FHO) also compensate physicians based on the number and demographics of enrolled patients.
- British Columbia and Nova Scotia have implemented variations of a Longitudinal Family Physician (LFP) Payment Model. LFPs compensate family physicians based on factors like time spent with patients, patient panel size, and the complexity of care. They claim to promote team-based, patient-partnered care.
The Audit is a reader-supported publication.
To receive new posts and support my work, consider becoming a free or paid subscriber.
Invite your friends and earn rewards
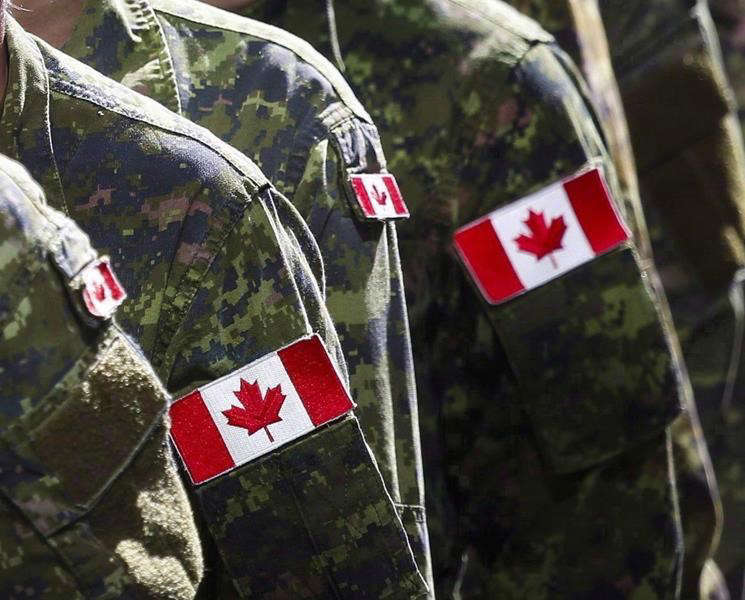

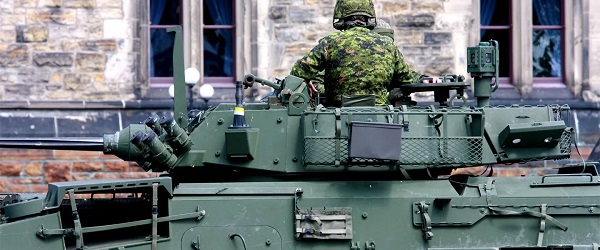
To my great surprise I recently noticed that, despite being deeply engaged in wars against at least four determined enemies, Israel doesn’t spend all that much more on their military than Canada does on its forces. What might that tell us about government efficiency?
There’s fairly universal agreement that Canada doesn’t spend enough on its military. But before we can even ask how much we should be spending, we should understand how much we’re already spending. And figuring that out isn’t nearly as easy as I’d expected.
According to the 2025–26 Expenditures by Purpose data released by the Treasury Board Secretariat, the Department of National Defence (DND) was allocated $35.7 billion (CAN). However, the New York Times recently reported that Primer Minister Carney’s $9.3 billion increase would bring the total defence-related spending to $62.7 billion – which suggests that, prior to the increase, we were set to spend $53.4 billion (CAN).
So I’ll work with both of those figures: $35.7 billion ($26 billion USD) and the pre-announcement $53.4 billion ($39 billion USD). By contrast, Israel currently spends around $37 billion (USD) on the Israel Defense Forces (IDF) which is in the neighborhood of 18 percent of their total budget.¹ The IDF is (literally) getting a much bigger bang for their buck.²
I’m going to compare the military inventories of both countries to get a sense of what a dollar of government spending can get you. I understand that this isn’t an apples-to-apples comparison and there are many complicating factors here. But I think the exercise could lead us to some useful insights. First off, here’s a very rough estimate of existing inventories:
 |
I’m sure there are plenty of caveats we could apply to those numbers, including how much of that equipment is actually fit for service on any given day. But they’ll have to do.
In addition, there are currently 68,000 regular troops in the Canadian Armed Forces (CAF) along with 22,500 reserves, while the IDF employs 169,500 regular troops and 465,000 reserves. They also cost money.
Based on some very rough estimates,³ I’d assess the value of IDF assets at around 2.6 times the value of comparable CAF assets. That means that the IDF – using their procurement systems – would need to spend just $14.4 billion (USD) to purchase the equivalent of the current set of CAF assets.
Now compare that with our actual (pre-increase) expenditures of either $26 billion USD or $39 billion USD and it seems that we’re overspending by either 80 percent or 270 percent.
I think we’d be wise to wonder why that is.
For full context, Israel receives around $3.8 billion (USD) in military aid annually from the U.S.
Speaking of which, for simplicity, I completely left the ongoing costs of ordinance out of my calculations.
If you’re really interested, you can see my calculations here.
Subscribe to The Audit.
For the full experience, upgrade your subscription.

 David Clinton
Ontario’s Auditor General just released a performance audit on the Toronto District School Board. I’m sure it’ll surprise exactly no one that “financial and capital resources are not consistently allocated in the most cost-effective or efficient way” or that “The effective management of operations was not always being measured and assessed for internal decision-making”.
And there was plenty of institutional chaos:
“Between 2017/18 and 2022/23…about 38% of TDSB schools did not report conducting the minimum number of fire drills required by the Ontario Fire Code annually, and about 31% of TDSB schools did not report conducting the minimum number of lockdown drills required by TDSB policy annually. The TDSB does not have an effective process to ensure the required number of drills are performed by each school, each year, or that they are performed in accordance with TDSB policy when performed.”
What else would you expect from a massive government bureaucracy that employs 40,000 people, spends $3.6 billion annually and – based on many of the highlighted items on their website – is laser-focused on pretty much anything besides education?
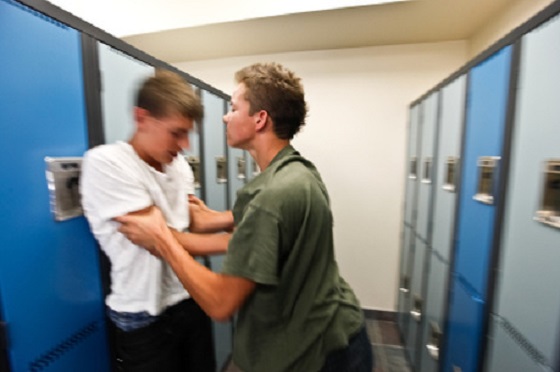
What you might not have seen coming was that around half of the report centered on in-school violence. To be sure, we’re told that there were only 407 violent events reported to the board during the 2022/2023 school year – which is a rate of around 17 events for every 10,000 students. 17:10,000 doesn’t exactly sound like an environment that’s spiraling out of control.
There was a caveat:
“Due to input errors by principals, the TDSB underreported the number of violent incidents that occurred between 2017/18 to 2021/22 to the Ministry by about 9%.”
Ok. But we’re still nowhere near Mad Max levels of violence. So what’s attracting so much of the auditor’s attention? Perhaps it’s got something to do with a couple of recent surveys whose results don’t quite match the board’s own records. Here’s how the audit describes the first of those:
“The 2022/23 TDSB Student and Parent Census was responded to by over 138,000 students, parents, guardians and caregivers. It showed that 23% of students in Grades 4 to 12 that responded to the survey said they were physically bullied (e.g., grabbed, shoved, punched, kicked, tripped, spat at), and about 71% stated they were verbally bullied (e.g., sworn at, threatened, insulted, teased, put down, called names, made fun of). Further, about 14% of student respondents indicated they had been cyberbullied. TDSB’s central tracking of all bullying incidents is much lower than this, suggesting that they are not centrally capturing a large number of bullying incidents that are occurring.”
“23% of students in Grades 4 to 12 that responded to the survey said they were physically bullied”. That’s not a great fit with that 17:10,000 ratio, even if you add the 9 percent of underreported incidents. And bear in mind that these students and their families were willing to discuss their experiences in a survey run by the school board itself, so it’s not like they’re hard to find.
But that’s not the worst of it. The Elementary Teachers’ Federation of Ontario (ETFO) ran their own survey in 2023. They wanted to hear about their members’ experiences with workplace violence. Here, quoting from the audit report, is what TDSB respondents told them:
- 42% had experienced physical force against themselves in 2022/23;
- 18% had experienced more than 10 of these physical force incidents in 2022/23;
- 81% indicated the number of violent incidents increased since they started working;
- about 77% responded that violence was a growing problem at their school;
- about 29% indicated they had suffered a physical injury;
- 57% had suffered a psychological injury/illness (such as mental stress, psychological or emotional harm) as a result of workplace violence against them; and
- about 85% indicated that violence at their school made teaching and working with students more difficult.
29 percent of teachers suffered a physical injury due to workplace violence. That’s elementary school teachers we’re talking about.
For perspective, even accounting for the 9 percent underreporting, the TDSB was aware of events impacting less than a quarter of a percentage point of their students (and apparently didn’t report any violence against teachers). But by their own accounts, 23 percent of all students and 42 percent of elementary teachers have suffered attacks. Are board officials willfully ignoring this stuff?
And if only there was some way to address violence and other criminal activities on school property. Perhaps – and I’m just spitballing here – there could even be people working in schools whose job it would be to (what’s the word I’m looking for?) police crime.
On a completely unrelated note, back in November, 2017, the Toronto District School Board voted 18-3 to permanently end their School Resource Officer (SRO) program. Since then, police officers have been unwelcome on board property.
To be sure, the TDSB has “accepted” all 18 of the report’s recommendations. But talk is cheap. Who’s to say that commitment won’t play out the same way we’ve seen with their fire drill compliance.
Can you spell “class action lawsuit”?
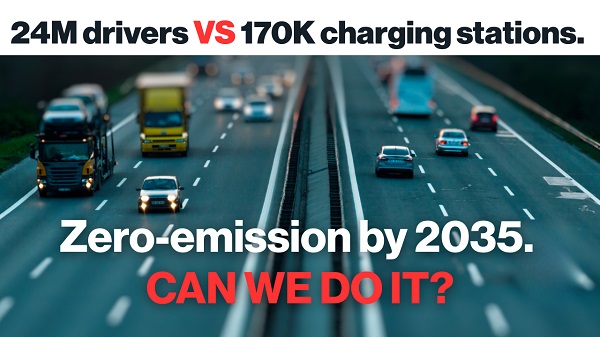
Power Struggle: Electric vehicles and reality
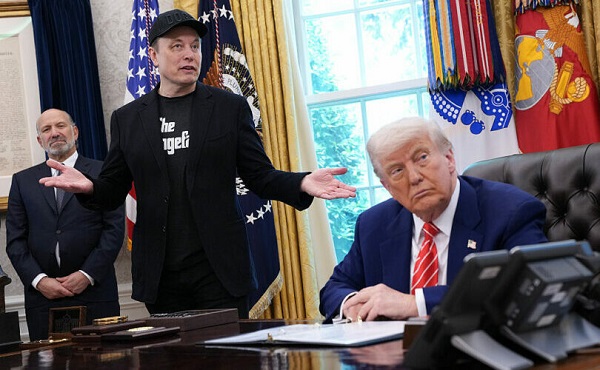
Elon Musk slams Trump’s ‘Big Beautiful Bill,’ calls for new political party

RFK Jr. Unloads Disturbing Vaccine Secrets on Tucker—And Surprises Everyone on Trump

Electric vehicle sales are falling hard in BC, and it is time to recognize reality.

Canada Caves: Carney ditches digital services tax after criticism from Trump
Alberta judge sides with LGBT activists, allows ‘gender transitions’ for kids to continue
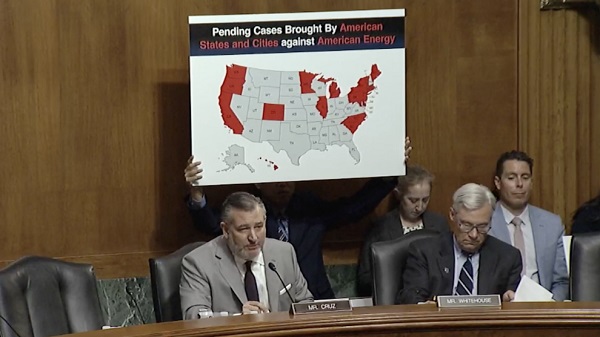
China undermining American energy independence, report says
-
 armed forces1 day ago
Canada’s Military Can’t Be Fixed With Cash Alone
-
 Alberta1 day ago
COVID mandates protester in Canada released on bail after over 2 years in jail
-
 International1 day ago
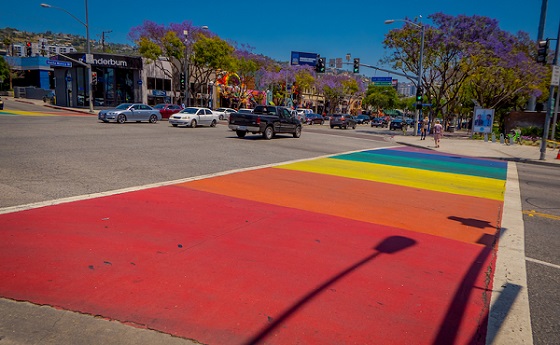
Trump transportation secretary tells governors to remove ‘rainbow crosswalks’
-
 Business1 day ago
Carney’s spending makes Trudeau look like a cheapskate
-
 Business1 day ago
Canada’s loyalty to globalism is bleeding our economy dry
-
 Alberta1 day ago
Alberta Next: Alberta Pension Plan
-
 Crime2 days ago
Project Sleeping Giant: Inside the Chinese Mercantile Machine Linking Beijing’s Underground Banks and the Sinaloa Cartel
-
 C2C Journal24 hours ago
Canada Desperately Needs a Baby Bump