Business
What Inter-Provincial Migration Trends Can Tell Us About Good Governance


It turns out we move a great deal less than our American neighbors
Government policies have consequences. Among them is the possibility that they might so annoy the locals that people actually get up and head for the exit. Given how parting can be such sweet sorrow (and how it’s a pain to lose out on all that revenue from provincial income, property, and sales tax), legislatures generally prefer to keep their citizens on this side of the door.

Nevertheless, migration happens. And when enough people do it at the same time, they sometimes leave economic and social clues behind waiting to be discovered. This graph represents net migrations since 1971 into and out of the four largest provinces:
The Audit is a reader-supported publication. To receive new posts and support my work, consider becoming a free or paid subscriber.
 |
It may just be possible to make out some broad patterns here. Quebec has never had a net inbound migration year (although there’s been plenty of immigration to Quebec from outside of Canada). But nothing matches the mass exodus of anglophones due to concerns over language and separation in the 1970s.
Curiously it seems that Alberta and British Columbia received far more migrants than Ontario around that time – although the actual numbers tell us that they were more likely to have come from Saskatchewan and Ontario than Quebec. By contrast, most disillusioned Quebecers found their way to Ontario. Besides the 70s, Alberta also enjoyed inbound spikes in the mid-90s, mid-00s, and early 10s. And it looks like they’re in the middle of another boom cycle as we speak.
The real value of all this data however, is in using it to test causation hypotheses. In other words, can statistical analysis tell us what it was that caused the migrations? And are some or all of those causes the result of government policy choices? Here are some possibilities we’ll explore:
- Household income trends
- Government debt
- Crime rates
- Healthcare costs
- Housing costs
Right off the top I’ll come clean with you: there’ll be no smoking gun here. I could find no single historical measure that came close to explaining migration patterns. However I was able to confidently discard some theories. That’s a win I guess. And other numbers did hint to intriguing possibilities.
Inter-provincial variations in household income, crime rates (specifically murder rates), healthcare costs (including prescriptions, eye care, and dental care), and even housing affordability had no measurable impact on migration. This was true for both correlation coefficients and lag analysis (where we looked at migration changes in the years following an economic event).
Rising unemployment had, at best, a minimal impact on outbound migration. And even then, it was only noticeable for Alberta and Prince Edward Island.
Of all the metrics I explored, the only one that might have had a serious influence in migration was provincial government budget deficits.
Folks from Alberta, New Brunswick, and Newfoundland all responded to growing government debt by clearing out. Now, I doubt this was their way to telling the government what they really thought about bad fiscal management. Rather, people probably decided to move to greener pastures in response to the ripple-effect consequences of deficits, like higher taxes, reduced social services, and deteriorating infrastructure.
I suspect that part of the reason I wasn’t able to find any strong connections between those metrics and migration patterns is because there really isn’t all that much migration going on in the first place.
Take Ontario’s record net population loss of 31,018 residents back in 2021. That may sound like a lot of people, but it’s actually just a hair over two-tenths of one percent of the total Ontario population. And even Quebec’s epic 1979 loss of 46,429 people was still nowhere near one percent. It was 0.7117456, to be precise. Those aren’t significant numbers.
When so few people choose to move, it’s probably because there’s nothing on the macro level going on that’s pushing them. Those who do go, probably do it primarily for personal reasons that just won’t show up in population-scale data.
There’s also the very real possibility that Canadians are smart enough to realize that things probably won’t be any better over there than they already are right here. Fewer than two-thirds of one percent of Ontarians left for other provinces in 2023, while only around one-third of a percent gave up on Quebec.
By contrast, annual state-to-state migration figures in the U.S. typically range between 1 percent to 5 percent of each state’s population. In 2022, that added up to 8.2 million people, according to the Census Bureau.
In the market for bespoke data analysis?
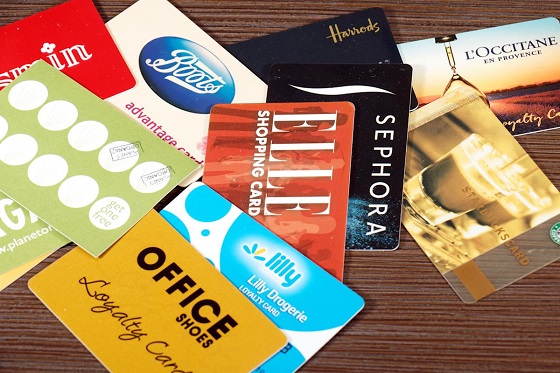
You’ve certainly been asked (begged!) to join up for at least one loyalty “points” program – like PC Optimum, Aeroplan, or Hilton Honors – over the years. And the odds are that you’re currently signed up for at least one of them. In fact, the average person apparently belongs to at no less than 14 programs. Although, ironically, you’ll need to sign up to an online equivalent of a loyalty program to read the source for that number.
Well all that warm, fuzzy “belonging” comes with some serious down sides. Let’s see how much they might cost us.
To be sure, there’s real money involved here. Canadians redeem at least two billion dollars in program rewards each year, and payouts will often represent between one and ten percent of the original purchase value.
At the same time, it’s estimated that there could be tens of billions of unredeemed dollars due to expirations, shifting program terms, and simple neglect. So getting your goodies isn’t automatic.
The Audit is a reader-supported publication.
To receive new posts and support my work, consider becoming a free or paid subscriber.
Just why do consumer-facing corporations agree to give away so much money in the fist place?
As you probably already know, it’s about your data. Businesses are willing to pay cold, hard cash in exchange for detailed descriptions of your age, sex, ethnicity, wealth, location, employment status, hobbies, preferences, medical conditions, political leanings, and, of course, shopping habits.
Don’t believe it works? So then why, after all these years, are points programs still giving away billions of dollars?
Every time you participate in such a program, the data associated with that activity will be collected and aggregated along with everything else known about you. It’s more than likely that points-based data is being combined with everything connected to your mobile phone account, email addresses, credit cards, provincial health card, and – possibly – your Social Insurance number. The depth and accuracy of your digital profile improves daily.
What happens to all that data? A lot of it is shared with – or sold to – partners or affiliates for marketing purposes. Some of it is accidentally (or intentionally) leaked to organized criminal gangs driving call center-related scams. But it’s all about getting to know you better in ways that maximize someone’s profits.
One truly scary way this data is used involves surveillance pricing (also known as price discrimination) – particularly as it’s described in a recent post by Professor Sylvain Charlebois.
The idea is that retailers will use your digital profile to adjust the prices you pay at the cash register or when you’re shopping online. The more loyal you are as a customer, the more you’ll pay. That’s because regular (“loyal”) customers are already reliable revenue sources. Companies don’t need to spend anything to build a relationship with you. But they’re more than willing to give up a few percentage points to gain new friends.
I’m not talking about the kind of price discrimination that might lead to higher prices for sales in, say, urban locations to account for higher real estate and transportation costs. Those are just normal business decisions.
What Professor Charlebois described is two customers paying different prices for the same items in the same stores. In fact, a recent Consumer Reports experiment in the U.S. involving 437 shoppers in four cities found the practice to be quite common.
But the nasty bit here is that there’s growing evidence that retailers are using surveillance pricing in grocery stores for basic food items. Extrapolating from the Consumer Reports study, such pricing could be adding $1,200 annually to a typical family’s spending on basic groceries.
I’m not sure what the solution is. It’s way too late to “unenroll” from our loyalty accounts. And government intervention would probably just end up making things worse.
But perhaps getting the word out about what’s happening could spark justified mistrust in the big retailers. No retailer enjoys dealing with grumpy customers.
Be grumpy.
The Audit is a reader-supported publication.
To receive new posts and support my work, consider becoming a free or paid subscriber.
Business
Largest fraud in US history? Independent Journalist visits numerous daycare centres with no children, revealing massive scam

A young journalist has uncovered perhaps the largest fraud scheme in US history.
He certainly isn’t a polished reporter with many years of experience, but 23 year old independent journalist Nick Shirley seems to be getting the job done. Shirley has released an incredible video which appears to outline fraud after fraud after fraud in what appears to be a massive taxpayer funded scheme involving up to $9 Billion Dollars.
In one day of traveling around Minneapolis-St. Paul, Shirley appears to uncover over $100 million in fraudulent operations.
🚨 Here is the full 42 minutes of my crew and I exposing Minnesota fraud, this might be my most important work yet. We uncovered over $110,000,000 in ONE day. Like it and share it around like wildfire! Its time to hold these corrupt politicians and fraudsters accountable
We ALL… pic.twitter.com/E3Penx2o7a
— Nick shirley (@nickshirleyy) December 26, 2025


Australian PM booed at Bondi vigil as crowd screams “shame!”

Mortgaging Canada’s energy future — the hidden costs of the Carney-Smith pipeline deal

The “Disruptor-in-Chief” places Canada in the crosshairs
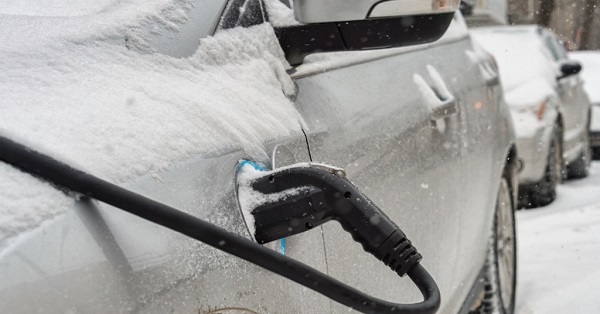
Canada’s EV gamble is starting to backfire

End Supply Management—For the Sake of Canadian Consumers
UK Police Pilot AI System to Track “Suspicious” Driver Journeys

Judge Declares Mistrial in Landmark New York PRC Foreign-Agent Case
-
Business1 day ago
Largest fraud in US history? Independent Journalist visits numerous daycare centres with no children, revealing massive scam
-
 Haultain Research11 hours ago
Sweden Fixed What Canada Won’t Even Name
-
 Business1 day ago
“Magnitude cannot be overstated”: Minnesota aid scam may reach $9 billion
-
 Censorship Industrial Complex1 day ago
US Under Secretary of State Slams UK and EU Over Online Speech Regulation, Announces Release of Files on Past Censorship Efforts
-
Business11 hours ago
What Do Loyalty Rewards Programs Cost Us?