Business
The ESG Shell Game Behind The U.S. Plastics Pact

![]()
From the Daily Caller News Foundation
By Jack McPherrin and H. Sterling Burnett
In recent years, corporate coalitions have increasingly taken center stage in environmental policymaking, often through public-private partnerships aligned with environmental, social, and governance (ESG) goals that promise systemic change.

One of the most prominent examples is the U.S. Plastics Pact (USPP). At first glance, the USPP may appear to some as a promising solution for reducing plastic pollution. But in practice, it has encouraged companies to make changes that are more cosmetic than environmental—and in some cases, actively counterproductive—while increasing their control over the market.
The USPP, launched in 2020, consists of more than 850 companies, non-profits, research institutions, government agencies, and other entities working together to create a new “circular economy for plastics.” Dozens of major retailers and consumer goods companies—including Coca-Cola, Danone, Kraft Heinz, Target, and Unilever—have signed on as “Activators,” pledging to eliminate certain plastics, shift to recyclable packaging, and increase the use of recycled plastics.
Yet, rather than curbing plastic production or reducing waste, the USPP has led many companies to simply transition from polystyrene to polyethylene terephthalate (PET). This shift has been encouraged by claims that PET is more widely recyclable, easier to sort, and better aligned with existing U.S. recycling infrastructure.
However, polystyrene is more moldable, is recyclable, and has insulation properties that PET doesn’t. In addition, PET is approximately 30 percent heavier than polystyrene, meaning more material is required for the same functional use. Moreover, PET requires more energy and is more expensive to produce than polystyrene. And PET’s denser packaging increases transportation-related greenhouse gas emissions and raises costs even more—though these higher costs don’t bother USPP participants, as they simply pass them on to consumers.
Only 5 to 6 percent of all plastics in the United States are recycled. Even for PET products, the overall recycling rate remains low. Just one-third of PET bottles are recycled, while the recycling rate for many other PET products such as thermoforms is less than 10 percent. Most PET products end up in landfills.
This ineffective, costly, and counterproductive shift was not accidental. It reflects the broader incentives baked into ESG scoring systems that reward superficial compliance over substantive outcomes.
ESG frameworks reward companies financially and reputationally for achieving certain narrow targets such as reductions in single-use plastics or increases in the use of packaging that is technically recyclable. However, these metrics often fail to accurately assess total plastic use in a product’s lifecycle, associated emissions, and real-world recovery. A package that uses more plastic and energy—and therefore generates more emissions—may still earn high sustainability marks, so long as the plastic is recyclable in theory. This is a textbook example of greenwashing.
A closer look at the USPP reveals that some of the world’s top plastic users and producers—Coca-Cola, PepsiCo, and Nestlé—are among the Pact’s strongest backers. These corporations, which produce billions of PET containers per year, benefit substantially from signing onto agreements such as the USPP, adopting ESG standards, and pledging support for various green goals—even if they do not deliver any green results. In fact, a 2022 report found that a large majority of retail signatories to the USPP actually increased their consumption of virgin plastic from 2020 to 2021.
Many of these same companies fund the non-profit that organized the USPP: the Ellen MacArthur Foundation. This creates a feedback loop in which large companies shape sustainability standards to their own advantage, defining which materials are “acceptable,” reaping the rewards of ESG compliance, and marginalizing smaller firms that lack the resources to adapt.
For example, by promoting PET as the preferred packaging material, the USPP conveniently reinforces the existing supply chains of these multinational bottlers, while sidelining other materials such as polystyrene that may be more cost-efficient and suitable for specific applications. Smaller manufacturers, who can’t easily switch packaging or absorb the added costs, are effectively squeezed out of the marketplace.
The USPP has not built a circular economy. Rather, it has constructed a closed circle of corporate sponsors that gain reputational boosts and higher ESG scores on the backs of consumers, despite increasing energy and plastics use.
The USPP unites ESG financiers, government agencies, nonprofits, and the largest corporate polluters in a mutually beneficial arrangement. This system rewards compliance, deflects scrutiny, manipulates public trust, eliminates free-market competition, stifles innovation, and increases costs to consumers—all while creating more waste.
Policymakers and consumers alike must recognize that ESG-aligned coalitions such as the U.S. Plastics Pact are nothing more than corporate lobbying groups disguised as sustainability initiatives. They do not improve environmental quality, but they do profit immensely from the illusion of doing so.
Jack McPherrin ([email protected]) is a Research Fellow for the Glenn C. Haskins Emerging Issues Center and H. Sterling Burnett, Ph.D., ([email protected]) is the Director of the Arthur B. Robinson Center on Climate and Environmental Policy, both at The Heartland Institute, a non-partisan, non-profit research organization based in Arlington Heights, Illinois.


The Canadian Taxpayers Federation is calling on the federal, Ontario and municipal governments to publicly reject subsidizing a new arena for the Ottawa Senators.
“Politicians need to stand up for taxpayers and tell the Ottawa Senators’ lobbyists NO,” said Noah Jarvis, CTF Ontario Director. “Prime Minister Mark Carney, Ontario Premier Doug Ford and Ottawa Mayor Mark Sutcliffe all need to publicly reject giving taxpayers’ money to the owners of the Ottawa Senators.”
The Ottawa Citizen recently reported that “the Ottawa Senators have a team off the ice lobbying federal and provincial governments for funds to help pay the hefty price tag for a new arena.”
The Ottawa Senators said they don’t intend on asking the city of Ottawa for taxpayer dollars. However, the Ottawa Citizen reported that “it’s believed Senators’ owner Michael Andlauer would like a similar structure to the [Calgary] arena deal.” The Calgary arena deal included municipal subsidies.
As of December 2024, the Ottawa Senators were worth just under $1.2 billion, according to Forbes.
Meanwhile, both the federal and Ontario governments are deep in debt. The federal debt will reach $1.35 trillion by the end of the year. The Ontario government is $459 billion in debt. The city of Ottawa is proposing a 3.75 per cent property tax increase in 2026.
“Governments are up to their eyeballs in debt and taxpayers shouldn’t be forced to fund a brand-new fancy arena for a professional sports team,” said Franco Terrazzano, CTF Federal Director. “If the owners of the Ottawa Senators want to build a fancy new arena, then they should be forced to fund it with ticket sales not tax hikes.”

From the Fraser Institute
By Jake Fuss and Grady Munro
The number of Canadians donating to charity—as a percentage of all tax filers—is at the lowest point in 20 years, finds a new study published by the
Fraser Institute, an independent, non-partisan Canadian public policy think-tank.
“The holiday season is a time to reflect on charitable giving, and the data shows Canadians are consistently less charitable every year, which means charities face greater challenges to secure resources to help those in need,” said Jake Fuss, director of Fiscal Studies at the Fraser Institute and co-author of Generosity in Canada: The 2025 Generosity Index.
The study finds that the percentage of Canadian tax filers donating to charity during the 2023 tax year—just 16.8 per cent—is the lowest proportion of Canadians donating since at least 2003. Canadians’ generosity peaked at 25.4 per cent of tax-filers donating in 2004, before declining in subsequent years.
Nationally, the total amount donated to charity by Canadian tax filers has also fallen from 0.55 per cent of income in 2013 to 0.52 per cent of income in 2023.
The study finds that Manitoba had the highest percentage of tax filers that donated to charity among the provinces (18.7 per cent) during the 2023 tax year while New Brunswick had the lowest (14.4 per cent).
Likewise, Manitoba also donated the highest percentage of its aggregate income to charity among the provinces (0.71 per cent) while Quebec and Newfoundland and Labrador donated the lowest (both 0.27 per cent).
“A smaller proportion of Canadians are donating to registered charities than what we saw in previous decades, and those who are donating are donating less,” said Fuss.
“This decline in generosity in Canada undoubtedly limits the ability of Canadian charities to improve the quality of life in their communities and beyond,” said Grady Munro, policy analyst and co-author.
Generosity of Canadian provinces and territories
Ranking (2025) % of tax filers who claiming donations Average of all charitable donations % of aggregate income donated
Manitoba 18.7 $2,855 0.71
Ontario 17.2 $2,816 0.58
Quebec 17.1 $1,194 0.27
Alberta 17.0 $3,622 0.68
Prince Edward Island 16.6 $1,936 0.45
Saskatchewan 16.4 $2,597 0.52
British Columbia 15.9 $3,299 0.61
Nova Scotia 15.3 $1,893 0.40
Newfoundland and Labrador 15.0 $1,333 0.27
New Brunswick 14.4 $2,076 0.44
Yukon 14.1 $2,180 0.27
Northwest Territories 10.2 $2,540 0.20
Nunavut 5.1 $2,884 0.15
NOTE: Table based on 2023 tax year, the most recent year of comparable data in Canada
Generosity in Canada: The 2025 Generosity Index
- Manitoba had the highest percentage of tax filers that donated to charity among the provinces (18.7%) during the 2023 tax year while New Brunswick had the lowest (14.4%).
- Manitoba also donated the highest percentage of its aggregate income to charity among the provinces (0.71%) while Quebec and Newfoundland and Labrador donated the lowest (both 0.27%).
- Nationally, the percentage of Canadian tax filers donating to charity has fallen over the last decade from 21.9% in 2013 to 16.8% in 2023.
- The percentage of aggregate income donated to charity by Canadian tax filers has also decreased from 0.55% in 2013 to 0.52% in 2023.
- This decline in generosity in Canada undoubtedly limits the ability of Canadian charities to improve the quality of life in their communities and beyond.

Jake Fuss
Director, Fiscal Studies, Fraser Institute

Grady Munro
Policy Analyst, Fraser Institute


The Trickster Politics of the Tanker Ban are Hiding a Much Bigger Reckoning for B.C.
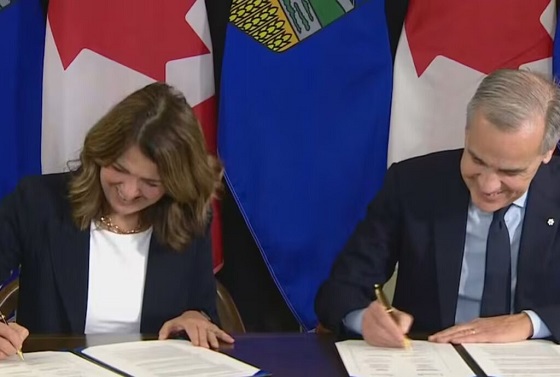
What the Data Shows About the New Canada-Alberta Pipeline Opportunity

While Trump has southern border secure, hundreds of thousands of illegal immigrants still flooding in from Canada

Alberta will use provincial laws to stop Canadian gov’t from trying to confiscate legal firearms
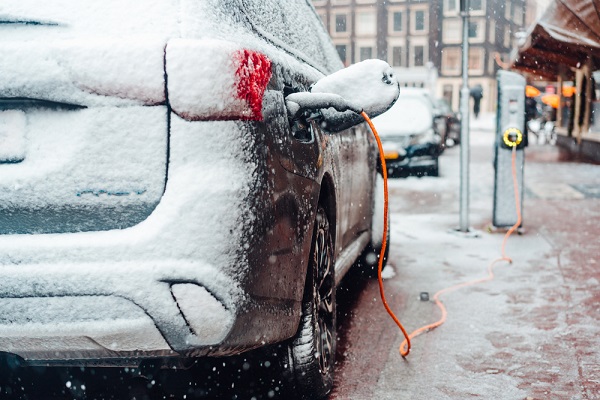
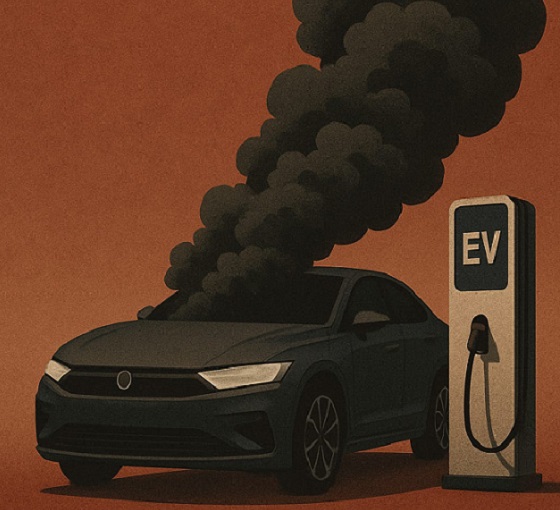
Canada’s EV Mandate Is Running On Empty

Why Does Canada “Lead” the World in Funding Racist Indoctrination?

Can the COVID Scamsters Stick the Landing?
-
 Automotive1 day ago
The $50 Billion Question: EVs Never Delivered What Ottawa Promised
-
 Business2 days ago
Conservative MP warns Liberals’ national AI plan could increase gov’t surveillance
-
 Great Reset2 days ago
Proposed ban on euthanasia for mental illness sparks passionate debate in Canada’s Parliament
-
 Censorship Industrial Complex2 days ago
Liberals gain support for ‘hate speech’ bill targeting Bible passages against homosexuality
-
 Business2 days ago
Storm clouds of uncertainty as BC courts deal another blow to industry and investment
-
 C2C Journal1 day ago
Wisdom of Our Elders: The Contempt for Memory in Canadian Indigenous Policy
-
 Agriculture1 day ago
Growing Alberta’s fresh food future
-
 Health2 days ago
US podcaster Glenn Beck extends a lifeline to a Saskatchewan woman waiting for MAiD