Canadian Energy Centre
Reality check: Global emissions from coal plants
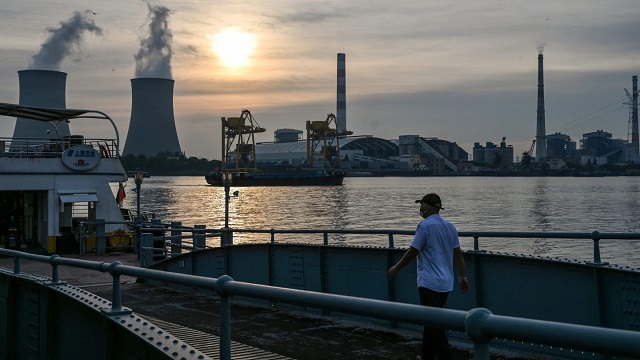

A man walks towards a ferry as the Wujing coal-electricity power station is seen across the Huangpu River in the Minhang district of Shanghai. Getty Images photo
From the Canadian Energy Centre

Coal remains the primary fuel for global electricity generation, particularly in Asian countries
High energy prices, inflation, war, and the ongoing economic recovery from the pandemic has highlighted the general worldwide demand for electricity, particularly in Asia and Europe. The growing demand for electricity on these two continents has led some electricity producing plants to rely increasingly heavily on coal as a power source.
The electricity sector accounts for 34 per cent of the world’s energy-related carbon dioxide (CO2) emissions. In this Fact Sheet, we detail recent trends in electricity production and demand across the globe as well as CO2 emissions from the electricity sector worldwide.
Carbon dioxide emissions from the world’s top ten emitters between 2000 and 2022
A total of 38.2 gigatonnes (Gt) of energy-related CO2 was emitted globally in 2022, an increase of 53 per cent from 2000. However, the increase is not consistent for all countries; between 2000 and 2023, CO2 emissions trends diverged. Emissions from China, India, and Indonesia more than doubled in the last two decades, whereas emissions for other countries remained relatively consistent or even declined.
In 2022, Canada’s total energy-related CO2 emissions were 0.62 Gt, or 1.6 per cent of the global total. That compares to emissions of 0.64 Gt in South Korea, 1.09 Gt in Japan, 2.8 Gt in India, 5.0 Gt in the United States, and 13.0 Gt in China (see Figure 1).

Sources: IEA World Energy Statistics database and Enerdata
Demand for electricity and sources of emissions
Global domestic electricity consumption increased from 13,188 terawatt-hours (TWh) in 2000 to 25,681 TWh in 2022 and estimates are that global demand for electricity will rise to 35,000 TWh by 2040.¹
That is a jump of 94 per cent, or 12,492 TWh, between 2000 and 2022. During the same period, electricity consumption in Asia rose a whopping 280 per cent. In Africa the demand for electricity increased by 90 per cent (see Figure 2). Coal remains the world’s largest source of fuel for electricity generation, with approximately 10,317 terawatt-hours of electricity generated by coal-fired plants in 2022 (see Figure 3).
1. The IEA’s Electricity Market Report 2022 states that nearly all of the increase is attributable to growing electricity consumption in developing countries across southeast Asia and Africa.

Sources: IEA World Energy Statistics database and Enerdata

Sources: IEA World Energy Statistics database and Enerdata
In recent years, electricity generated from the combustion of coal declined in Canada, the United States, Europe, and Africa. However, electricity generated from coal combustion has continued to grow in China, India, and other parts of Asia.
Between 2000 and 2022, the share of coal-powered electricity generation in Asia increased from 49.8 to 56. 3 per cent, while in Canada it decreased from 19.4 per cent to less than 5 per cent.

Sources: IEA World Energy Statistics database and Enerdata
Source of emissions in the electricity sector
The electricity sector accounts for 34 per cent of the carbon dioxide emitted across the world. The sector emitted 13.05 gigatonnes of CO2 in 2022, an increase of 5.01 Gt from 2000. In Asia, between 2000 and 2022, CO2 emissions from the electricity sector increased from 2.5 Gt to 8.3 Gt and the sector’s share of carbon dioxide (CO2) emissions increased from just over 32 per cent to well over 40 per cent (see Figure 5).

Sources: IEA World Energy Statistics database and Enerdata
Coal burned to generate electricity accounts for the majority of the CO2 emitted in power generation. In 2022, coal-fired electricity\ generation accounted for 9.89 Gt, or nearly 76 per cent of the worldwide CO2 emissions from the electricity sector. The share was even higher in Asia where 92 per cent of emissions from the electricity sector come from coal combustion. Asian coal-fired plants accounted for 7.62 Gt of the total 8.26 Gt of emissions from the sector on that continent (see Figure 6).

Sources: IEA World Energy Statistics database and Enerdata
Conclusion
The global electricity sector, and particularly the sector in Asia, is a major source of CO2 emissions. Relative to Canada’s existing carbon emissions, emissions from the coal-fired power plants worldwide will make any reductions in Canada’s carbon emissions and resulting job losses, higher taxes, and higher costs for consumers and businesses—meaningless.
As 56 per cent of the electricity in Asia is generated by coal-fired plants, a transition from coal- to gas-fired electricity generation in the region could lead to significant reductions in CO2 emissions, reducing emissions by 50 per cent on average. The corollary is that there is a potential market in Asia for natural gas extracted in and exported from Canada. Canada has an opportunity to play a useful and meaningful role in reducing CO2 emissions from the electricity sector by encouraging and contributing to the global natural gas market.
Notes
This CEC Fact Sheet was compiled by Ven Venkatachalam at the Canadian Energy Centre (www.canadianenergycentre.ca). The author and the Canadian Energy Centre would like to thank and acknowledge the assistance of an anonymous reviewer in reviewing the data and research for this Fact Sheet.
References (live as of November 2, 2023)
Canadian Energy Centre (November 7, 2022), Canadian LNG has massive opportunity in Asia: report <https://tinyurl.com/2p9525j6>; Enerdata (2022), Power Plant Tracker database <https://bit.ly/3xfgOdF>; IEA (2022), Electricity Market Report – January 2022 <https://bit.ly/3M0723j> IEA (Undated), World Energy Statistics Database <https://tinyurl.com/ytz789m4>
From the Canadian Energy Centre
‘We are excited to bring this made-in-Canada innovation to the world’
To the naked eye, it looks about as exciting as baking soda or table salt.
But to the scientists in the University of Calgary chemistry lab who have spent more than a decade working on it, this white powder is nothing short of amazing.
That’s because the material they invented is garnering global attention as a new solution to help address climate change.
Known as Calgary Framework-20 (CALF-20 for short), it has “an exceptional capacity to absorb carbon dioxide” and was recognized in connection with the 2025 Nobel Prize in Chemistry.
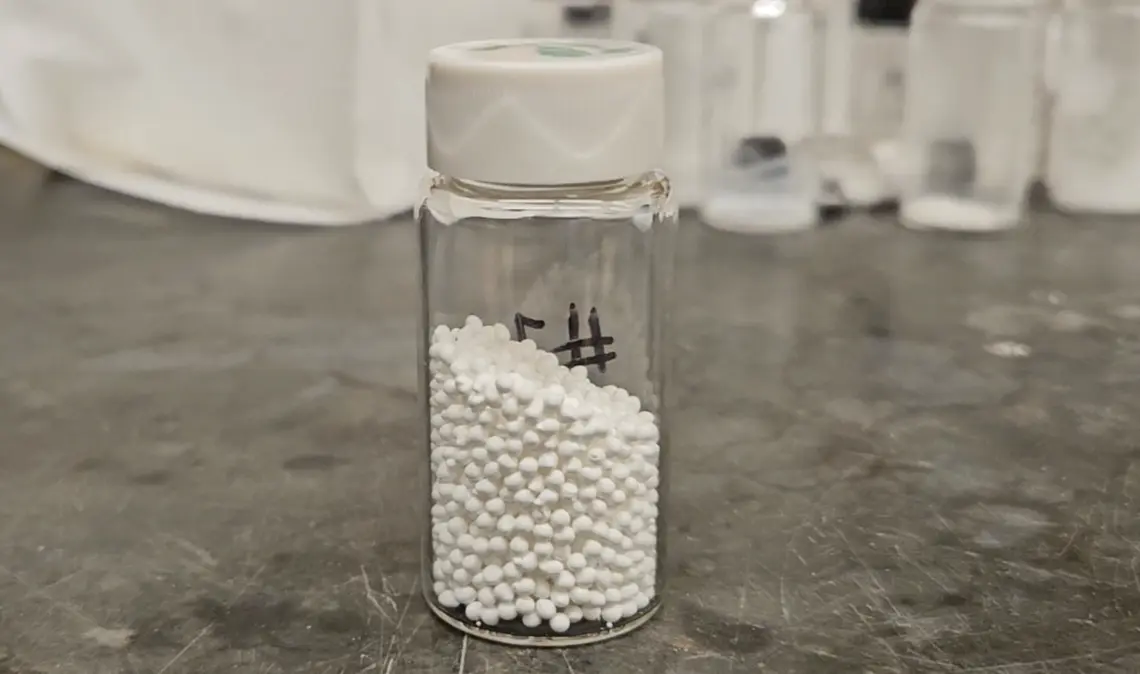
A jar of CALF-20, a metal-organic framework (MOF) used in carbon capture. Photo courtesy UCalgary
“It’s basically a molecular sponge that can adsorb CO2 very efficiently,” said Dr. George Shimizu, a UCalgary chemistry professor who leads the research group that first developed CALF-20 in 2013.
The team has been refining its effectiveness ever since.
“CALF-20 is a very exciting compound to work on because it has been a great example of translating basic science into something that works to solve a problem in the real world,” Shimizu said.
Advancing CCS
Carbon capture and storage (CCS) is not a new science in Alberta. Since 2015, operating projects in the province have removed 15 million tonnes of CO2 that would have otherwise been emitted to the atmosphere.
Alberta has nearly 60 proposed facilities for new CCS networks including the Pathways oil sands project, according to the Regina-based International CCS Knowledge Centre.
This year’s Nobel Prize in Chemistry went to three of Shimizu’s colleagues in Japan, Australia and the United States, for developing the earliest versions of materials like CALF-20 between 1989 and 2003.
Custom-built molecules
CALF-20 is in a class called metal-organic frameworks (MOFs) — custom-built molecules that are particularly good at capturing and storing specific substances.
MOFs are leading to new technologies for harvesting water from air in the desert, storing toxic gases, and capturing CO2 from industrial exhaust or directly from the atmosphere.
CALF-20 is one of the few MOF compounds that has advanced to commercial use.
“There has been so much discussion about all the possible uses of MOFs, but there has been a lot of hype versus reality, and CALF-20 is the first to be proven stable and effective enough to be used at an industrial scale,” Shimizu said.
It has been licensed to companies capturing carbon across a range of industries, with the raw material now being produced by the tonne by chemical giant BASF.

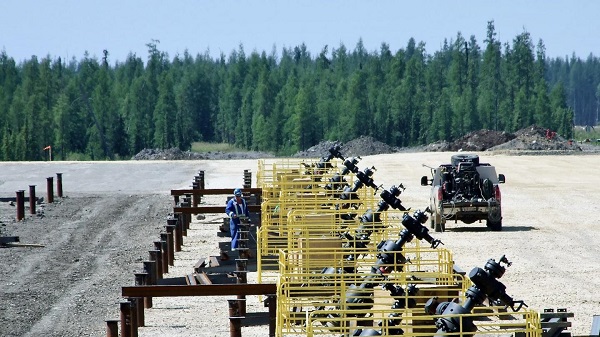
CO2 pipeline at the Quest CCS project near Edmonton, Alta. Photo courtesy Shell Canada
Carbon capture filter gigafactory
Svante Inc. has demonstrated its CALF-20-based carbon capture system at a cement plant in British Columbia.
The company recently opened a “gigafactory” in Burnaby equipped to manufacture enough carbon capture and removal filters for up to 10 million tonnes of CO2 annually, equivalent to the emissions of more than 2.3 million cars.
The filters are designed to trap CO2 directly from industrial emissions and the atmosphere, the company says.
Svante chief operating officer Richard Laliberté called the Nobel committee’s recognition “a profound validation” for the entire field of carbon capture and removal.
CALF-20 expansion
Meanwhile, one of Shimizu’s former PhD students helped launch a spinoff company, Existent Sorbents, to further expand the applications of CALF-20.
Existent is working with oil sands producers, a major steel factory and a U.S.-based firm capturing emissions from other point sources, said CEO Adrien Côté.
“The first users of CALF-20 are leaders who took the risk of introducing new technology to industries that are shrewd about their top and bottom lines,” Côté said.
“It has been a long journey, but we are at the point where CALF-20 has proven to be resilient and able to survive in harsh real-world conditions, and we are excited to bring this made-in-Canada innovation to the world.”
Construction of an oil sands SAGD production well pad in northern Alberta. Photo supplied to the Canadian Energy Centre
From the Canadian Energy Centre
The facts about one of Canada’s biggest industries
Alberta’s oil sands sector is one of Canada’s most important industries — and also one of its most misunderstood.
Here are five common myths, and the facts behind them.
Myth: Oil sands emissions are unchecked

Steam generators at a SAGD oil sands production site in northern Alberta. Photo courtesy Cenovus Energy
Reality: Oil sands emissions are strictly regulated and monitored. Producers are making improvements through innovation and efficiency.
The sector’s average emissions per barrel – already on par with the average oil consumed in the United States, according to S&P Global – continue to go down.
The province reports that oil sands emissions per barrel declined by 26 per cent per barrel from 2012 to 2023. At the same time, production increased by 96 per cent.
Analysts with S&P Global call this a “structural change” for the industry where production growth is beginning to rise faster than emissions growth.
The firm continues to anticipate a decrease in total oil sands emissions within the next few years.
The Pathways Alliance — companies representing about 95 per cent of oil sands activity — aims to significantly cut emissions from production through a major carbon capture and storage (CCS) project and other innovations.
Myth: There is no demand for oil sands production
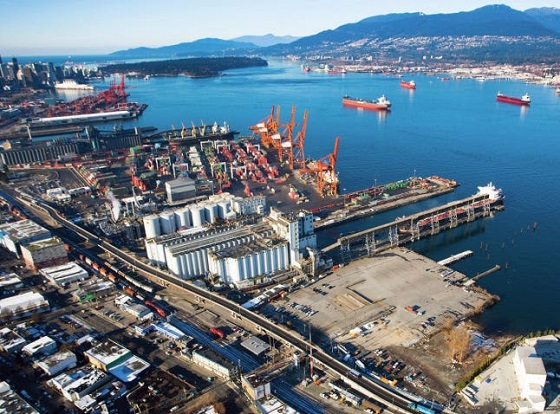
Expanded export capacity at the Trans Mountain Westridge Terminal. Photo courtesy Trans Mountain Corporation
Reality: Demand for Canadian oil – which primarily comes from the oil sands – is strong and rising.
Today, America imports more than 80 per cent more oil from Canada than it did in 2010, according to the U.S. Energy Information Administration (EIA).
New global customers also now have access to Canadian oil thanks to the opening of the Trans Mountain pipeline expansion in 2024.
Exports to countries outside the U.S. increased by 180 per cent since the project went into service, reaching a record 525,000 barrels per day in July 2025, according to the Canada Energy Regulator.
The world’s appetite for oil keeps growing — and it’s not stopping anytime soon.
According to the latest EIA projections, the world will consume about 120 million barrels per day of oil and petroleum liquids in 2050, up from about 104 million barrels per day today.
Myth: Oil sands projects cost too much

Heavy haulers at an oil sands mining operation in northern Alberta. Photo courtesy Suncor Energy
Reality: Operating oil sands projects deliver some of the lowest-cost oil in North America, according to Enverus Intelligence Research.
Unlike U.S. shale plays, oil sands production is a long-life, low-decline “manufacturing” process without the treadmill of ongoing investment in new drilling, according to BMO Capital Markets.
Vast oil sands reserves support mining projects with no drilling, and the standard SAGD drilling method involves about 60 per cent fewer wells than the average shale play, BMO says.
After initial investment, Enverus says oil sands projects typically break even at less than US$50 per barrel WTI.
Myth: Indigenous communities don’t support the oil sands

Chief Greg Desjarlais of Frog Lake First Nation signs an agreement in September 2022 whereby 23 First Nations and Métis communities in Alberta acquired an 11.57 per cent ownership interest in seven Enbridge-operated oil sands pipelines for approximately $1 billion. Photo courtesy Enbridge
Reality: Indigenous communities play an important role in the oil sands sector through community agreements, business contracts and, increasingly, project equity ownership.
Oil sands producers spent an average of $1.8 billion per year with 180 Indigenous-affiliated vendors between 2021 and 2023, according to the Canadian Association of Petroleum Producers.
Indigenous communities are now owners of key projects that support the oil sands, including Suncor Energy’s East Tank Farm (49 per cent owned by two communities); the Northern Courier pipeline system (14 per cent owned by eight communities); and the Athabasca Trunkline, seven operating Enbridge oil sands pipelines (~12 per cent owned by 23 communities).
These partnerships strengthen Indigenous communities with long-term revenue, helping build economic reconciliation.
Myth: Oil sands development only benefits people in Alberta

The Toronto Stock Exchange (TSX) on Bay St. Getty Images photo
Reality: Oil sands development benefits Canadians across the country through reliable energy supply, jobs, taxes and government revenues that help pay for services like roads, schools and hospitals.
The sector has contributed approximately $1 trillion to the Canadian economy over the past 25 years, according to analysis by the Macdonald-Laurier Institute (MLI).
That reflects total direct spending — including capital investment, operating costs, taxes and royalties — not profits or dividends for shareholders.
More than 2,300 companies outside of Alberta have had direct business with the oilsands, including over 1,300 in Ontario and almost 600 in Quebec, MLI said.
Energy products are by far Canada’s largest export, representing $196 billion, or about one-quarter of Canada’s total trade in 2024, according to Statistics Canada.
Led by the oil sands, Canada’s energy sector directly or indirectly employs more than 445,000 people across the country, according to Natural Resources Canada.


From Underdog to Top Broodmare
Trans Mountain executive says it’s time to fix the system, expand access, and think like a nation builder
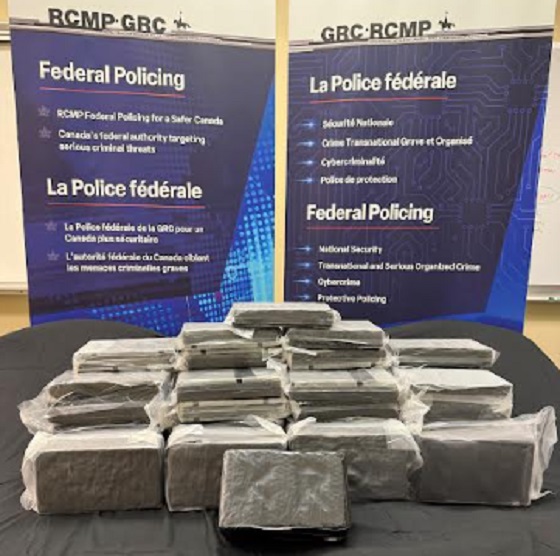
Coutts border officers seize 77 KG of cocaine in commercial truck entering Canada – Street value of $7 Million
CAPP calls on federal government to reset energy policy before it’s too late

The painful return of food inflation exposes Canada’s trade failures

Trump Raises US Tariffs on Canadian Products by 10% after Doug Ford’s $75,000,000 Ad Campaign

Premier Smith sending teachers back to school and setting up classroom complexity task force
-
Alberta1 day ago
From Underdog to Top Broodmare
-
 International2 days ago
Prince Andrew banished from the British monarchy
-
 Business2 days ago
“We have a deal”: Trump, Xi strike breakthrough on trade and fentanyl
-
 Alberta2 days ago
Province orders School Boards to gather data on class sizes and complexity by Nov 24
-
 Crime2 days ago
Canada Seizes 4,300 Litres of Chinese Drug Precursors Amid Trump’s Tariff Pressure Over Fentanyl Flows
-
 Alberta2 days ago
How one major media torqued its coverage – in the take no prisoners words of a former Alberta premier
-
 National2 days ago
Watchdog Presses Ottawa to Release Hidden Lobbying Rulings
-
 International1 day ago
Netanyahu orders deadly strikes on Gaza with over 100 dead despite ceasefire deal