Business
Chainsaws and Scalpels: How Governments Choose
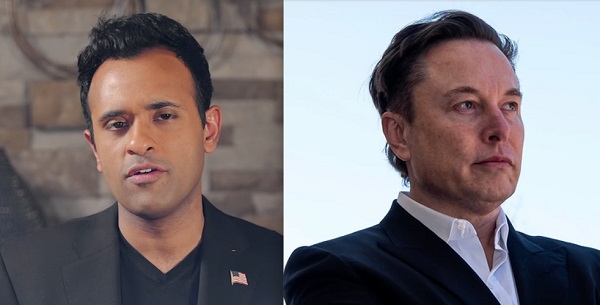


Javier Milei in Argentina, Musk and Ramaswamy in the US.. What does DOGE in Canada look like?
Under their new(ish) president Javier Milei, Argentina cut deeply and painfully into their program spending to address a catastrophic economic crisis. And they seem to have enjoyed some early success. With Elon Musk now primed to play a similar role in the coming Trump administration in the U.S., the obvious question is: how might such an approach play out in Canada?
Sure. We’re not suffering from headaches on anything like the scale of Argentina’s – the debt we’ve run up so far isn’t in the same league as the long-term spending going on in South America. But ignoring the problems we do face can’t be an option. Given that the annual interest payments on our existing national debt are $11.7 billion (which equals seven percent of total expenditures), simply balancing the budget won’t be enough.
The underlying assumption powering the question is that we live in a world of constraints. There just isn’t enough money to buy everything we might want, so we need to both prioritize and become more efficient. It’s about figuring out what can no longer be justified – even if it does provide some value – and what’s just plain wasteful.
The Audit is a reader-supported publication. To receive new posts and support my work, consider becoming a free or paid subscriber.
Some of this may seem obvious. After all, when there are First Nations reserves without clean water and millions of Canadians without access to primary care physicians, how can we justify spending hundreds of millions of dollars funding arts projects that virtually no one will ever discover, much less consume?
Apparently not everyone sees things that way. Large governments operate by reacting to political, social, and chaos-driven incentives. Sometimes those incentives lead to rational choices, and sometimes not. But mega-sized organizations tend to lack the self-awareness and capacity to easily change direction.
And some basic problems have no obvious solutions. As I’ve written, there’s a real possibility that all the money in the world won’t buy the doctors, nurses, and integrated systems we need. And “all the money in the world” is obviously not on the table. So the well-meaning bureaucrat might conclude that if you’re not going to completely solve the big problems, you might as well try to manage them while investing in other areas, too.
Still, I think it’s worth imagining how things might look if we could launch a comprehensive whole-of-government program review.
How Emergency Cuts Might Play Out
Imagine the federal government defaulted on its debt servicing payments and lost access to capital markets. That’s not such an unlikely scenario. There would suddenly be a lot less money available to spend, and some programs would have to be shut down. Protecting emergency and core services would require making fast – and smart – decisions.
We would need to take a long, hard look at this important enumeration of government expenditures. There probably wouldn’t be enough time to bridge the gap by looking for dozens of less-critical million-dollar programs. We would need to find some big-ticket items fast.
Our first step might be to pause or restructure larger ongoing payments, like projects funded through the Canada Infrastructure Bank (total annual budget: $3.45 billion). Private investors might pick up some of the slack, or some projects could simply go into hibernation. “Other interest costs” (total annual budget: $4.6 billion) could also be restructured.
Reducing equalization payments (total annual budget: $25.2 billion) and territorial financing (total budget: $5.2 billion) might also be necessary. This would, of course, spark parallel crises at lower levels of government. Similarly, grants to settle First Nations claims (total budget: $6 billion) managed by Crown-Indigenous Relations and Northern Affairs Canada would also be at least temporarily cut.
All that would be deeply painful and trigger long-term negative consequences.
But there’s a far better approach that could be just as effective and a whole lot less painful:
What an All-of-Government Review Might Discover
Planning ahead would allow you the luxury of targeting spending that – in some cases at least – wouldn’t even be missed. Think about programs that were announced five, ten, even thirty years ago, perhaps to satisfy some passing fad or political need. They might even have made sense decades ago when they were created…but that was decades ago when they were created.
Here’s how that’ll work. When you read through the program and transfer spending items on that government expenditures page (and there are around 1,200 of those items), the descriptions all point to goals that seem reasonable enough. But there are some important questions that should be asked about each of them:
- When did these programs begin?
- What specific activities do they involve?
- What have they accomplished over the past 12 months?
- Is their effectiveness trending up or down?
- Are they employing efficiency best-practices used in the private sector?
- Who’s tasked with monitoring changes?
- Where are their reports published?
To show you what I mean, here are some specific transfer or program line items and their descriptions:
Department of Employment and Social Development
- Workforce Development Agreements ($722 million)
- Indigenous Early Learning and Child Care Transformation Initiative ($374 million)
- Payments to provinces, territories, municipalities, other public bodies, organizations, groups, communities, employers and individuals for the provision of training and/or work experience, the mobilization of community resources, and human resource planning and adjustment measures necessary for the efficient functioning of the Canadian labour market ($856 million)
Department of Industry
- Contributions under the Strategic Innovation Fund ($2.4 billion)
Department of Citizenship and Immigration
- Settlement Program ($1.13 billion)
Department of Indigenous Services
- Contributions to provide income support to on-reserve residents and Status Indians in the Yukon Territory ($1.05 billion). Note that, as of the 2021 Census, there were 9,150 individuals with North American Indigenous origins in Yukon. Assuming the line item is accurately described, that means the income support came to $114,987/person (not per household; per person).
Each one of those (and many, many others like them) could be case studies in operational efficiency and effectiveness. Or not. But there’s no way we could know that without serious research.
 |
The Audit is a reader-supported publication. To receive new posts and support my work, consider becoming a free or paid subscriber.
Invite your friends and earn rewards


The Canadian Taxpayers Federation is calling on the federal, Ontario and municipal governments to publicly reject subsidizing a new arena for the Ottawa Senators.
“Politicians need to stand up for taxpayers and tell the Ottawa Senators’ lobbyists NO,” said Noah Jarvis, CTF Ontario Director. “Prime Minister Mark Carney, Ontario Premier Doug Ford and Ottawa Mayor Mark Sutcliffe all need to publicly reject giving taxpayers’ money to the owners of the Ottawa Senators.”
The Ottawa Citizen recently reported that “the Ottawa Senators have a team off the ice lobbying federal and provincial governments for funds to help pay the hefty price tag for a new arena.”
The Ottawa Senators said they don’t intend on asking the city of Ottawa for taxpayer dollars. However, the Ottawa Citizen reported that “it’s believed Senators’ owner Michael Andlauer would like a similar structure to the [Calgary] arena deal.” The Calgary arena deal included municipal subsidies.
As of December 2024, the Ottawa Senators were worth just under $1.2 billion, according to Forbes.
Meanwhile, both the federal and Ontario governments are deep in debt. The federal debt will reach $1.35 trillion by the end of the year. The Ontario government is $459 billion in debt. The city of Ottawa is proposing a 3.75 per cent property tax increase in 2026.
“Governments are up to their eyeballs in debt and taxpayers shouldn’t be forced to fund a brand-new fancy arena for a professional sports team,” said Franco Terrazzano, CTF Federal Director. “If the owners of the Ottawa Senators want to build a fancy new arena, then they should be forced to fund it with ticket sales not tax hikes.”

From the Fraser Institute
By Jake Fuss and Grady Munro
The number of Canadians donating to charity—as a percentage of all tax filers—is at the lowest point in 20 years, finds a new study published by the
Fraser Institute, an independent, non-partisan Canadian public policy think-tank.
“The holiday season is a time to reflect on charitable giving, and the data shows Canadians are consistently less charitable every year, which means charities face greater challenges to secure resources to help those in need,” said Jake Fuss, director of Fiscal Studies at the Fraser Institute and co-author of Generosity in Canada: The 2025 Generosity Index.
The study finds that the percentage of Canadian tax filers donating to charity during the 2023 tax year—just 16.8 per cent—is the lowest proportion of Canadians donating since at least 2003. Canadians’ generosity peaked at 25.4 per cent of tax-filers donating in 2004, before declining in subsequent years.
Nationally, the total amount donated to charity by Canadian tax filers has also fallen from 0.55 per cent of income in 2013 to 0.52 per cent of income in 2023.
The study finds that Manitoba had the highest percentage of tax filers that donated to charity among the provinces (18.7 per cent) during the 2023 tax year while New Brunswick had the lowest (14.4 per cent).
Likewise, Manitoba also donated the highest percentage of its aggregate income to charity among the provinces (0.71 per cent) while Quebec and Newfoundland and Labrador donated the lowest (both 0.27 per cent).
“A smaller proportion of Canadians are donating to registered charities than what we saw in previous decades, and those who are donating are donating less,” said Fuss.
“This decline in generosity in Canada undoubtedly limits the ability of Canadian charities to improve the quality of life in their communities and beyond,” said Grady Munro, policy analyst and co-author.
Generosity of Canadian provinces and territories
Ranking (2025) % of tax filers who claiming donations Average of all charitable donations % of aggregate income donated
Manitoba 18.7 $2,855 0.71
Ontario 17.2 $2,816 0.58
Quebec 17.1 $1,194 0.27
Alberta 17.0 $3,622 0.68
Prince Edward Island 16.6 $1,936 0.45
Saskatchewan 16.4 $2,597 0.52
British Columbia 15.9 $3,299 0.61
Nova Scotia 15.3 $1,893 0.40
Newfoundland and Labrador 15.0 $1,333 0.27
New Brunswick 14.4 $2,076 0.44
Yukon 14.1 $2,180 0.27
Northwest Territories 10.2 $2,540 0.20
Nunavut 5.1 $2,884 0.15
NOTE: Table based on 2023 tax year, the most recent year of comparable data in Canada
Generosity in Canada: The 2025 Generosity Index
- Manitoba had the highest percentage of tax filers that donated to charity among the provinces (18.7%) during the 2023 tax year while New Brunswick had the lowest (14.4%).
- Manitoba also donated the highest percentage of its aggregate income to charity among the provinces (0.71%) while Quebec and Newfoundland and Labrador donated the lowest (both 0.27%).
- Nationally, the percentage of Canadian tax filers donating to charity has fallen over the last decade from 21.9% in 2013 to 16.8% in 2023.
- The percentage of aggregate income donated to charity by Canadian tax filers has also decreased from 0.55% in 2013 to 0.52% in 2023.
- This decline in generosity in Canada undoubtedly limits the ability of Canadian charities to improve the quality of life in their communities and beyond.

Jake Fuss
Director, Fiscal Studies, Fraser Institute

Grady Munro
Policy Analyst, Fraser Institute


The Trickster Politics of the Tanker Ban are Hiding a Much Bigger Reckoning for B.C.

While Trump has southern border secure, hundreds of thousands of illegal immigrants still flooding in from Canada
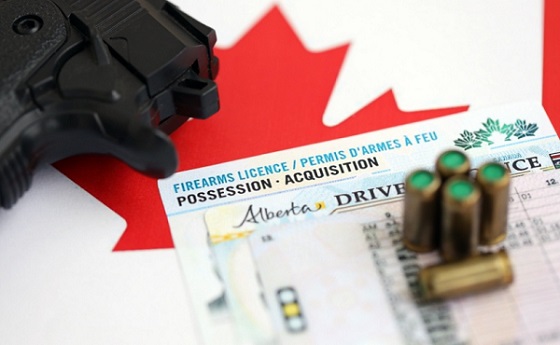
Alberta will use provincial laws to stop Canadian gov’t from trying to confiscate legal firearms
What the Data Shows About the New Canada-Alberta Pipeline Opportunity

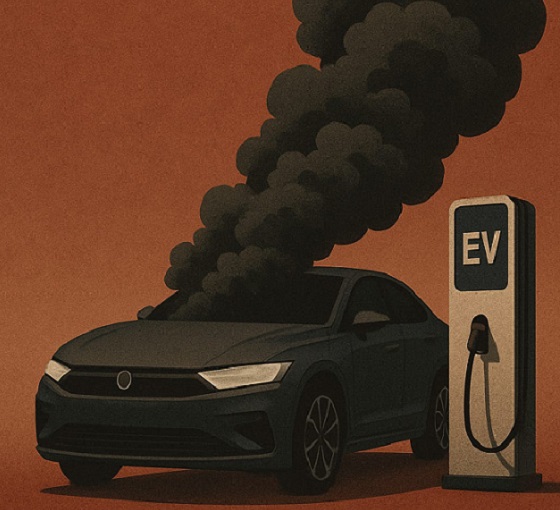
Canada’s EV Mandate Is Running On Empty
Why Does Canada “Lead” the World in Funding Racist Indoctrination?

Can the COVID Scamsters Stick the Landing?
-
 Business2 days ago
Conservative MP warns Liberals’ national AI plan could increase gov’t surveillance
-
 Great Reset2 days ago
Proposed ban on euthanasia for mental illness sparks passionate debate in Canada’s Parliament
-
 Censorship Industrial Complex2 days ago
Liberals gain support for ‘hate speech’ bill targeting Bible passages against homosexuality
-
 Automotive1 day ago
The $50 Billion Question: EVs Never Delivered What Ottawa Promised
-
 Agriculture1 day ago
Growing Alberta’s fresh food future
-
 Health2 days ago
US podcaster Glenn Beck extends a lifeline to a Saskatchewan woman waiting for MAiD
-
 Business2 days ago
Storm clouds of uncertainty as BC courts deal another blow to industry and investment
-
 C2C Journal1 day ago
Wisdom of Our Elders: The Contempt for Memory in Canadian Indigenous Policy