Energy
Unpacking the Growing Cost of Home Heating Bills

From EnergyNow.ca
By
Bills are one of life’s certainties, and in Canada, so is winter. When combined, the two add up to a growing affordability crisis across the country.
Lots has been said about the rising cost of daily essentials such as groceries and gas, but another factor weighing heavily on Canadians’ pocketbooks is the cost of heating their homes.
According to data from Statistics Canada:
- 15% of Canadians reduced or had to forgo necessities such as food or medicine for at least one month to pay an energy bill last year. To put that in perspective, based on the number of households there are in Canada today, roughly 2.5 million households had to forgo necessities in 2023.
- 14% of Canadian households kept their home at an unsafe or uncomfortable temperature because of unaffordable heating costs (approximately 2.3 million households).
- High energy prices also caused 10% of Canadian households (approximately 1.7 million households) to be late or unable to pay their energy bills in the past year.
In total, nearly 27% of households (4.5 million households) said it was difficult, or very difficult to meet financial needs in the second quarter of 2023.
These numbers concern us, and we know they are also a big concern for women across Canada who have told us they are adjusting their living conditions to keep costs down.
Engaged women are making trade-offs
Hilary Krauss, a 28-year-old who lives with her partner Mitch in Vancouver, told us that their apartment setting is now fixed at an “affordable” temperature, and they are now bundling up and adding layers of clothing to compensate for lower house temperatures.
Even those who can currently afford their heating bill are considering investing in technology such as solar panels to lower home heating costs over time.
“I want energy security and care about the environment,” said Angela Chung, a Calgary woman who told us she pays $400 per month for her utility bill. “The heating costs for my modest home are exorbitant. If I invest in solar panels, it will have an upfront cost. But I may break even in a decade, saving money in the long run.”
With costs ballooning, and concerns rising about affordability, that drove us to ask what exactly we are paying for in our energy bills.
Taxes are driving up energy costs
The three main components of your heating bill are energy charges, delivery and administration (what you pay utility companies), and various government taxes, including the federal carbon tax.
- Used energy (GJ or KWH)
The gigajoules or kilowatt hours of energy you used in the billing period. (This number can be an estimate or exact number.) - Delivery charges
Delivery charges include fixed and variable costs based on the length of your billing period and natural gas consumption. Both charges are often summed on your heating bill under “Delivery Total.” - Rate riders
Provincial utility commissions approve temporary charges/credits. Rate riders adjust for under/over collection of approved costs. - Transmission charge
A fee for accessing high-voltage wires and towers to transmit power from generation plants to distribution systems. - Federal carbon tax
A federal government tax on natural gas consumption.
These numbers vary across Canada based on different energy and home heating sources, so we collected bills from people in Alberta (Calgary and Sylvan Lake), Ontario (Barrie and Whitby) and British Columbia (Vancouver and Victoria) to compare.
Here’s what we found.
(1) Energy cost varies by province, and are rising every year
Just over half of Canadian households that reported having a primary heating system use a forced air furnace (51%) and one quarter (25%) use electric baseboard heaters, so we focused on these two sources.

Of the bills we looked at, people are paying an average of $135 per month to heat their home. With natural gas, the average winter month costs $160, compared to $110 with electricity.
Canadians are facing increased costs year-over-year for both natural gas (up 23.7% in 2023 over the year before), and electricity (up 1.6% in 2023).
The cost of electricity varies across Canada and can be a challenge to compare because there is a wide variation in market and rate structures.
Some provinces use tiered rates that increase or decrease based on usage, some provinces use flat-rate billing, and Ontario uses time-of-use rates where peak hours are billed at a higher rate than off-peak hours.
According to Statista, the average cost per kilowatt hour (kWh) for electricity in Canada is 19.2 cents, with the Northwest Territories paying the most, and Quebec paying the least per kWh.

(2) The carbon tax is nearly doubling home heating costs
The bills we examined show that the carbon tax accounts for 30% of heating costs for those who heat their homes with forced air furnaces that use natural gas.
In Alberta, for example, it costs about $1.80 per gigajoule (GJ) of natural gas, and an additional $3.33 per GJ in carbon tax. This means the tax is greater than the actual energy cost, nearly doubling the cost of a monthly bill.
For every $1 an Ontarian spends on natural gas, they pay an extra $1.66 on the carbon tax, according to the bills we examined. Again, the cost of the carbon tax is greater than the cost of energy used.

In Eastern Canada where home heating oil is the most used heating source, the carbon tax has been exempted (a fairness issue we’ve already explored in depth) so we have excluded it from this analysis.
Carbon tax increases will raise cost further
The federal carbon tax is set to increase by 23% on April 1, 2024, and it will rise every year until it nearly triples by 2030 over today’s rate.
The federal carbon tax was intended to incentivize people to consume less oil and gas, but we know from our national research that more than half of engaged women (52%) feel it isn’t working because it isn’t changing behaviour. It’s also putting undue pressure on remote and rural communities where alternative energy sources are not available.
Home heating is a necessity, not a luxury, and many Canadians do not have options on how they heat their home. With 46% of engaged women across Canada telling us they are concerned about energy affordability, it begs the question: Do you think what you pay for home heating is fair?
Let us know what you think about rising heating costs and these findings, and reach out to tell us how you’re managing the rising cost of living.

Alberta
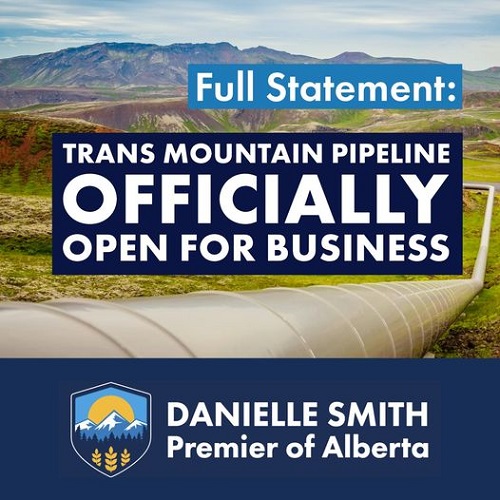
Official statement from Premier Danielle Smith and Energy Minister Brian Jean on the start-up of the Trans Mountain Pipeline
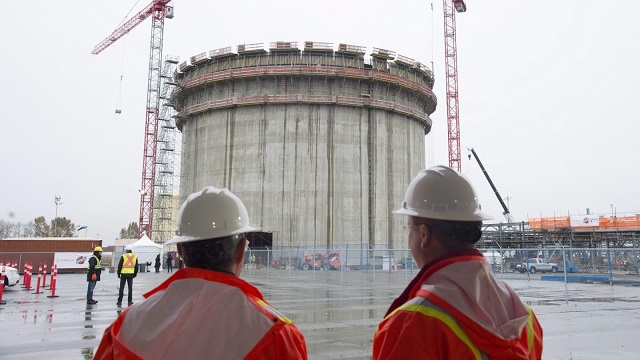
Construction workers look on at the FortisBC Tilbury LNG expansion project in Delta, B.C., Monday, Nov. 16, 2015. CP Images photo
From the Canadian Energy Centre
Lower costs for natural gas, shipping and liquefaction give Canada an edge in the emerging global LNG market
Worldwide concerns about energy security have put a renewed focus on the international liquefied natural gas (LNG) industry. The global demand for LNG is expected to increase over the next few decades.
Global demand growth will be driven primarily by Asian markets where the need for LNG is expected to increase from 277 million tonnes (MT) in 2025 to 509 MT by 2050 (see Figure 1). By 2050 the demand for LNG in Europe will be 83 MT and in Africa 20 MT. In South America too, demand will increase – from 13 MT in 2025 to 31 MT in 2050.

Source: Derived from Rystad Energy, Gas and LNG Markets Solution.
In North America (Canada, Mexico, and United States) a number of LNG projects that are either under construction or in the planning stages will benefit from the rise in global LNG demand.
North American LNG production is expected to grow from 112 MT in 2025 to over 255 MT by 2050 (see Figure 2). In Canada, the LNG projects under construction or in the planning stages include LNG Canada Phases 1 & 2, Woodfibre LNG, Cedar LNG, the Tilbury LNG expansion, and Ksi Lisims LNG. Canada’s LNG production is expected to grow from just 2 MT in 2025 to over 43 MT by 2050. In the United States production is projected to increase from 108 MT in 2025 to 210 MT in 2050.

Source: Derived from Rystad Energy, Gas and LNG Markets Solution.
This CEC Fact Sheet uses Rystad Energy’s Gas and LNG Markets Solution¹ to benchmark the cost competitiveness of LNG projects that are under construction and proposed in Canada compared to other LNG projects under construction and planned elsewhere in North America. (Note that the content of this report does not represent the views of Rystad Energy.)
The LNG cost competitiveness benchmarking analysis used the following performance metrics:
- LNG plant free-on-board (FOB) cost break-even;
- Total LNG plant cost (for delivery into Asia and Europe).
The objective of this LNG cost competitiveness benchmarking is to compare the competitiveness of Canadian LNG projects against those of major competitors in the United States and Mexico. The selection of other North American LNG facilities for the benchmark comparison with Canadian LNG projects (LNG Canada, the Tilbury LNG Expansion, Woodfibre LNG, Cedar LNG, and Ksi Lisims LNG) is based on the rationale that virtually all Canadian LNG plants are under construction or in the planning stage and that they compare well with other North American LNG plants that are also under construction or are being planned between 2023 and 2050. Further, to assess the cost competitiveness of the various LNG projects more accurately, we chose only North American LNG facilities with sufficient economic data to enable such a comparison. We compared the cost competitiveness of LNG coming from these other North American projects with LNG coming from Canada that is intended to be delivered to markets in Asia and Europe.
1. Rystad Energy is an independent energy research company providing data, analytics, and consultancy services to clients around the globe. Its Gas and LNG Markets Solution provides an overview of LNG markets worldwide. The Solution covers the entire value chain associated with gas and LNG production, country and sector-level demand, and LNG trade flows, infrastructure, economics, costs, and contracts through 2050. It allows for the evaluation of the entire LNG market infrastructure, including future planned projects, as well as the benchmarking of costs for LNG projects (Rystad Energy, 2024).
Comparison of LNG project FOB cost break-even (full cycle)
Figure 3 provides a comparison of the free-on-board (FOB) cost break-even for LNG facilities under construction or being planned in North America. FOB break-even costs include upstream and midstream costs for LNG excluding transportation costs (shipping) as seen from the current year. Break-even prices assume a discount rate of 10 percent and represent the point at which the net present value for an LNG project over a 20- to 30-year period becomes positive, including the payment of capital and operating costs, inclusive of taxes.
Among the selected group of North American LNG projects are Canadian LNG projects with an FOB break-even at the lower end of the range (US$7.18 per thousand cubic feet (kcf)) to those at the higher end (US$8.64 per thousand cubic feet (kcf)).
LNG projects in the United States tend to settle in the middle of the pack, with FOB break-even between US$6.44 per kcf and US$8.37 per kcf.

Mexico LNG projects have the widest variation in costs among the selected group of projects, ranging from US$6.94 per kcf to US$9.44 per kcf (see Figure 3).

Source: Derived from Rystad Energy, Gas and LNG Markets Solution.
Total costs by project for LNG delivery to Asia and Europe
The total cost by LNG plant includes FOB cost break-even, transportation costs, and the regasification tariff. Figure 4 compares total project costs for LNG destined for Asia from selected North American LNG facilities.
Canadian LNG projects are very cost competitive, and those with Asia as their intended market tend to cluster at the lower end of the scale. The costs vary by project, but range between US$8.10 per kcf and US$9.56 per kcf, making Canadian LNG projects among the lowest cost projects in North America.
The costs for Mexico’s LNG projects with Asia as the intended destination for their product tend to cluster in the middle of the pack. Costs among U.S. LNG facilities that plan to send their product to Asia tend to sit at the higher end of the scale, at between US$8.90 and US$10.80 per kcf.

Source: Derived from Rystad Energy, Gas and LNG Markets Solution.
Figure 5 compares total project costs for LNG to be delivered to Europe from select North American LNG facilities.
Costs from U.S. LNG facilities show the widest variation for this market at between US$7.48 per kcf and US$9.42 per kcf, but the majority of U.S. LNG facilities tend to cluster at the lower end of the cost scale, between US$7.48 per kcf and US$8.61 per kcf (see Figure 5).
Canadian projects that intend to deliver LNG to Europe show a variety of costs that tend to cluster at the middle to higher end of the spectrum, ranging from US$9.60 per kcf to and US$11.06 per kcf.
The costs of Mexico’s projects that are aimed at delivering LNG to Europe tend to cluster in the middle of the spectrum (US$9.11 per kcf to US$10.61 per kcf).

Source: Derived from Rystad Energy, Gas and LNG Markets Solution.
Conclusion
LNG markets are complex. Each project is unique and presents its own challenges. The future of Canadian LNG projects depends upon the overall demand and supply in the global LNG market. As the demand for LNG increases in the next decades, the world will be searching for energy security.
The lower liquefaction and shipping costs coupled with the lower cost of the natural gas itself in Western Canada translate into lower prices for Canadian LNG, particularly that destined for Asian markets. Those advantages will help make Canadian LNG very competitive and attractive to markets worldwide.


A Fed-Controlled Digital Dollar Could Mean The End Of Freedom
The EV ‘Bloodbath’ Arrives Early
Principal at Calgary Elementary School charged with possession of child pornography
Alberta threatens to fight Trudeau government restrictions on Canada’s plastics industry
-
Canadian Energy Centre2 days ago
North America LNG project cost competitiveness
-
 Alberta1 day ago
Official statement from Premier Danielle Smith and Energy Minister Brian Jean on the start-up of the Trans Mountain Pipeline
-
 conflict2 days ago
Columbia on Lockdown After pro-Palestinian Protesters Take Over Building, Hold Janitors Hostage
-
 Economy1 day ago
Today’s federal government—massive spending growth and epic betting
-
 Economy1 day ago
Young Canadians are putting off having a family due to rising cost of living, survey finds
-
 COVID-1923 hours ago
Canada’s COVID vaccine injury program has paid out just 6% of claims so far
-
 International1 day ago
NYPD storms protest-occupied Columbia building, several arrested
-
 International18 hours ago
U.S. birth rate hit record low last year, signaling surge in childlessness