Energy
Oil and gas in our lives: Women’s World Cup of Soccer

Players react moments after Australia’s forward #16 Hayley Raso (unseen) scored her team’s second goal during the Australia and New Zealand 2023 Women’s World Cup Group B football match between Canada and Australia at Melbourne Rectangular Stadium on July 31, 2023. Getty Images photo
This article from Shawn Logan of the Canadian Energy Centre Ltd.
‘The beautiful game’ wouldn’t look the same without petroleum products
The Adidas OCEAUNZ, official ball of the 2023 Women’s World Cup of Soccer, soars through the air, its polyurethane skin a blur as it arcs toward the goal.
The goalie makes a desperate dive across the emerald green natural turf – strengthened at the root for durability by flexible polypropylene fibres – to make the stop.
The ‘keeper’s hands, sheathed in high-tech gloves made primarily from latex and polyurethane, reach for the streaking ball.
The crowd leaps up from their moulded plastic seats as the ball hits the back of the net, an interlacing spiderweb most commonly made from polyethylene or nylon.
As soccer fans prepare for the Women’s World Cup final in Australia and New Zealand, it’s difficult to imagine how different the event, which is expected to be viewed by a staggering 2 billon people around the world, would look and feel without products derived from oil and gas.
At field level, nearly every practical aspect of the game relies on or is impacted by petroleum-based gear.
From the synthetic leather turf cleats and polyester jerseys to the players’ benches, water bottles and medical equipment that adorn the sidelines, all are made possible from the contributions of oil and gas products.

When a referee flashes a yellow or red card, it’s often made from a sturdy polyvinyl chloride, more commonly known as PVC.
Extending beyond the field, that trend continues.
From plastic spectator seating to polycarbonate scoreboards to advertising placards in and around the arena, all are thanks to the contributions of oil and gas. The event lights that encircle the arenas and the broadcasting equipment that allow the world to cheer their countries also rely heavily on products derived from petroleum.
Even the competing nations’ flags that drape the facilities are made from nylon and polyester.
With an expected 1.5 million spectators taking in the action in Australia and New Zealand, most will have had to travel by air or vehicle, which largely require oil and gas to operate.
And when Canada’s women return home – unfortunately without the result they wanted (Tokyo’s Olympic gold medal helps to ease the pain a bit) – they’ll arrive on an airplane built with light-weight polymers and carbon fibre that will touch down on a smooth runway made of asphalt and concrete, neither of which would be possible without oil and gas.
So while some may yearn for a return to the days of less aerodynamic leather balls, heavy cotton jerseys and fragile natural turf, the impact on “the beautiful game” would be enormous.

Alberta
Official statement from Premier Danielle Smith and Energy Minister Brian Jean on the start-up of the Trans Mountain Pipeline
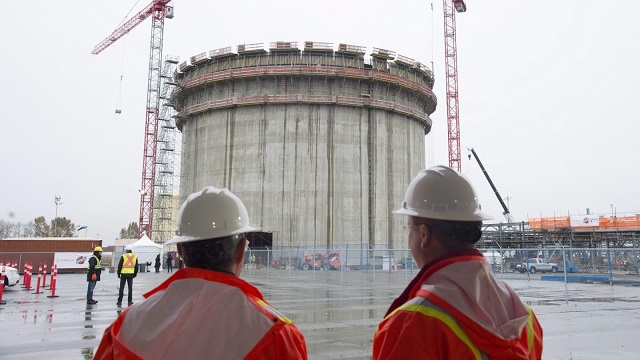
Construction workers look on at the FortisBC Tilbury LNG expansion project in Delta, B.C., Monday, Nov. 16, 2015. CP Images photo
From the Canadian Energy Centre
Lower costs for natural gas, shipping and liquefaction give Canada an edge in the emerging global LNG market
Worldwide concerns about energy security have put a renewed focus on the international liquefied natural gas (LNG) industry. The global demand for LNG is expected to increase over the next few decades.
Global demand growth will be driven primarily by Asian markets where the need for LNG is expected to increase from 277 million tonnes (MT) in 2025 to 509 MT by 2050 (see Figure 1). By 2050 the demand for LNG in Europe will be 83 MT and in Africa 20 MT. In South America too, demand will increase – from 13 MT in 2025 to 31 MT in 2050.

Source: Derived from Rystad Energy, Gas and LNG Markets Solution.
In North America (Canada, Mexico, and United States) a number of LNG projects that are either under construction or in the planning stages will benefit from the rise in global LNG demand.
North American LNG production is expected to grow from 112 MT in 2025 to over 255 MT by 2050 (see Figure 2). In Canada, the LNG projects under construction or in the planning stages include LNG Canada Phases 1 & 2, Woodfibre LNG, Cedar LNG, the Tilbury LNG expansion, and Ksi Lisims LNG. Canada’s LNG production is expected to grow from just 2 MT in 2025 to over 43 MT by 2050. In the United States production is projected to increase from 108 MT in 2025 to 210 MT in 2050.

Source: Derived from Rystad Energy, Gas and LNG Markets Solution.
This CEC Fact Sheet uses Rystad Energy’s Gas and LNG Markets Solution¹ to benchmark the cost competitiveness of LNG projects that are under construction and proposed in Canada compared to other LNG projects under construction and planned elsewhere in North America. (Note that the content of this report does not represent the views of Rystad Energy.)
The LNG cost competitiveness benchmarking analysis used the following performance metrics:
- LNG plant free-on-board (FOB) cost break-even;
- Total LNG plant cost (for delivery into Asia and Europe).
The objective of this LNG cost competitiveness benchmarking is to compare the competitiveness of Canadian LNG projects against those of major competitors in the United States and Mexico. The selection of other North American LNG facilities for the benchmark comparison with Canadian LNG projects (LNG Canada, the Tilbury LNG Expansion, Woodfibre LNG, Cedar LNG, and Ksi Lisims LNG) is based on the rationale that virtually all Canadian LNG plants are under construction or in the planning stage and that they compare well with other North American LNG plants that are also under construction or are being planned between 2023 and 2050. Further, to assess the cost competitiveness of the various LNG projects more accurately, we chose only North American LNG facilities with sufficient economic data to enable such a comparison. We compared the cost competitiveness of LNG coming from these other North American projects with LNG coming from Canada that is intended to be delivered to markets in Asia and Europe.
1. Rystad Energy is an independent energy research company providing data, analytics, and consultancy services to clients around the globe. Its Gas and LNG Markets Solution provides an overview of LNG markets worldwide. The Solution covers the entire value chain associated with gas and LNG production, country and sector-level demand, and LNG trade flows, infrastructure, economics, costs, and contracts through 2050. It allows for the evaluation of the entire LNG market infrastructure, including future planned projects, as well as the benchmarking of costs for LNG projects (Rystad Energy, 2024).
Comparison of LNG project FOB cost break-even (full cycle)
Figure 3 provides a comparison of the free-on-board (FOB) cost break-even for LNG facilities under construction or being planned in North America. FOB break-even costs include upstream and midstream costs for LNG excluding transportation costs (shipping) as seen from the current year. Break-even prices assume a discount rate of 10 percent and represent the point at which the net present value for an LNG project over a 20- to 30-year period becomes positive, including the payment of capital and operating costs, inclusive of taxes.
Among the selected group of North American LNG projects are Canadian LNG projects with an FOB break-even at the lower end of the range (US$7.18 per thousand cubic feet (kcf)) to those at the higher end (US$8.64 per thousand cubic feet (kcf)).
LNG projects in the United States tend to settle in the middle of the pack, with FOB break-even between US$6.44 per kcf and US$8.37 per kcf.

Mexico LNG projects have the widest variation in costs among the selected group of projects, ranging from US$6.94 per kcf to US$9.44 per kcf (see Figure 3).

Source: Derived from Rystad Energy, Gas and LNG Markets Solution.
Total costs by project for LNG delivery to Asia and Europe
The total cost by LNG plant includes FOB cost break-even, transportation costs, and the regasification tariff. Figure 4 compares total project costs for LNG destined for Asia from selected North American LNG facilities.
Canadian LNG projects are very cost competitive, and those with Asia as their intended market tend to cluster at the lower end of the scale. The costs vary by project, but range between US$8.10 per kcf and US$9.56 per kcf, making Canadian LNG projects among the lowest cost projects in North America.
The costs for Mexico’s LNG projects with Asia as the intended destination for their product tend to cluster in the middle of the pack. Costs among U.S. LNG facilities that plan to send their product to Asia tend to sit at the higher end of the scale, at between US$8.90 and US$10.80 per kcf.

Source: Derived from Rystad Energy, Gas and LNG Markets Solution.
Figure 5 compares total project costs for LNG to be delivered to Europe from select North American LNG facilities.
Costs from U.S. LNG facilities show the widest variation for this market at between US$7.48 per kcf and US$9.42 per kcf, but the majority of U.S. LNG facilities tend to cluster at the lower end of the cost scale, between US$7.48 per kcf and US$8.61 per kcf (see Figure 5).
Canadian projects that intend to deliver LNG to Europe show a variety of costs that tend to cluster at the middle to higher end of the spectrum, ranging from US$9.60 per kcf to and US$11.06 per kcf.
The costs of Mexico’s projects that are aimed at delivering LNG to Europe tend to cluster in the middle of the spectrum (US$9.11 per kcf to US$10.61 per kcf).

Source: Derived from Rystad Energy, Gas and LNG Markets Solution.
Conclusion
LNG markets are complex. Each project is unique and presents its own challenges. The future of Canadian LNG projects depends upon the overall demand and supply in the global LNG market. As the demand for LNG increases in the next decades, the world will be searching for energy security.
The lower liquefaction and shipping costs coupled with the lower cost of the natural gas itself in Western Canada translate into lower prices for Canadian LNG, particularly that destined for Asian markets. Those advantages will help make Canadian LNG very competitive and attractive to markets worldwide.


A Fed-Controlled Digital Dollar Could Mean The End Of Freedom
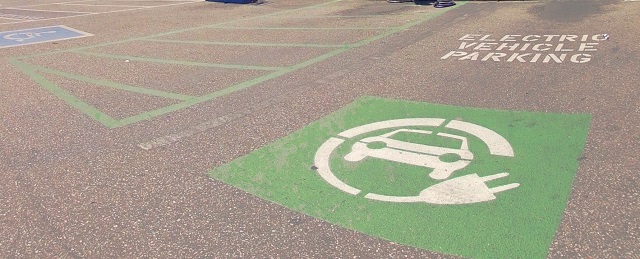
The EV ‘Bloodbath’ Arrives Early

Alberta threatens to fight Trudeau government restrictions on Canada’s plastics industry
Principal at Calgary Elementary School charged with possession of child pornography
-
 Alberta2 days ago
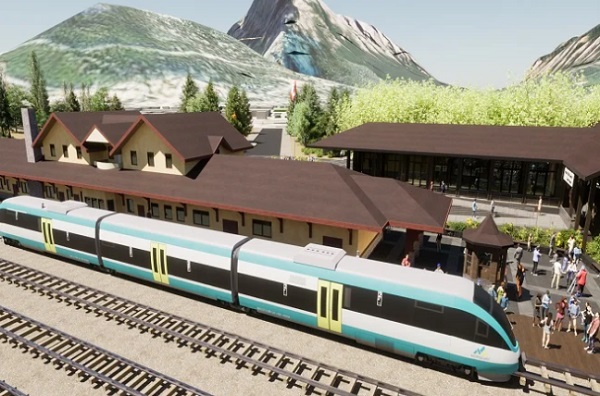
Alberta’s vision for passenger rail
-
 Alberta2 days ago
Three Calgary massage parlours linked to human trafficking investigation
-
 Uncategorized2 days ago
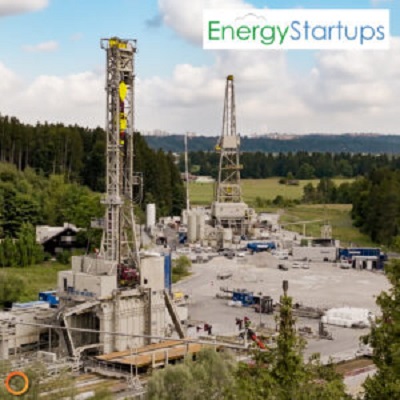
Making Alberta a geothermal energy leader
-
Canadian Energy Centre1 day ago
North America LNG project cost competitiveness
-
 conflict1 day ago
Columbia on Lockdown After pro-Palestinian Protesters Take Over Building, Hold Janitors Hostage
-
 Alberta15 hours ago
Official statement from Premier Danielle Smith and Energy Minister Brian Jean on the start-up of the Trans Mountain Pipeline
-
 Economy17 hours ago
Today’s federal government—massive spending growth and epic betting
-
 John Stossel2 days ago
Why Biden’s Just Wrong: NO ONE “Knows How to Make Government Work.”