
Myth: UN COP climate conferences have been a force for good, but COP 28 must lead to far more “climate action.”
Truth: These conferences are immoral because they deprive billions of the energy they need to prosper.
They should be replaced by energy freedom conferences.
Introduction
- The leadup to the COP 28 climate conference has had a consistent theme: previous COPs have done an okay job of restricting fossil fuels in the name of reducing greenhouse gas emissions, but this one needs to restrict fossil fuel use far faster so as to reach net-zero by 2050.
This is 180° wrong.1

- COP 28’s net-zero agenda—i.e., rapid elimination of fossil fuels—is unnecessary, and pursuing it faster would be catastrophic because
1. Fossil fuels are making us far safer from climate.
2. Even barely implementing COP’s net-zero agenda has been disastrous.
Fossil fuels are making us far safer from climate
The justification of COP 28’s net-zero agenda is that fossil fuel use is causing an escalating “climate crisis.”
But if we factor in fossil fuels’ many climate benefits and carefully weigh fossil fuels’ climate side-effects, the opposite is true.
- Factoring in fossil fuels’ “climate mastery benefits”
One huge benefit we get from fossil fuels is the ability to master climate danger—e.g., fossil-fueled cooling, heating, irrigation—which can potentially neutralize fossil fuels’ negative climate impacts.
- Example of fossil-fueled climate mastery overwhelming negative impacts: Drought.
Any contribution of rising CO2 to drought has been overwhelmed by fossil-fueled irrigation and crop transport, which have helped reduce drought deaths by more than 100 times over 100 years as CO2 levels have risen.2

- Even though we obviously need to factor in fossil fuels’ climate mastery benefits, our designated experts totally fail to do this.
E.g., the UN IPCC’s multi-thousand-page reports totally omit fossil-fueled climate mastery! That’s like a polio report omitting the polio vaccine.
- Carefully weighing fossil fuels’ climate side-effects
With rising greenhouse gasses we must be even-handed, considering both negatives (more heatwaves) and positives (fewer cold deaths). And we must be precise, not equating some impact with huge impact.
- Even though we obviously need to factor in both negative and positive impacts of rising CO2 with precision, most designated experts ignore big positives (e.g., global greening) while catastrophizing negatives (e.g., Gore portrays 20 feet sea level rise as imminent when extreme UN projections are 3 feet/100years).3
- Every report you hear about fossil fuels having made climate more dangerous commits at least one of 2 fallacies: ignoring the enormous climate mastery benefits of fossil fuels or wildly exaggerating negative climate side-effects of fossil fuels. Here’s how the prestigious IPCC does both.4
Alex Epstein – The IPCC’s perversion of science

- If we do factor in fossil fuels’ enormous climate mastery benefits and carefully weigh their climate side-effects, we find that fossil fuels are a tremendous climate net-positive and will remain so in the future.
- Myth: We are more endangered than ever by climate because of fossil fuels’ CO2 emissions.
Truth: We have a 98% decline in climate disaster deaths due to our enormous fossil-fueled climate mastery abilities: heating and cooling, infrastructure-building, irrigation, crop transport.5

- Myth: Climate-related disaster X shows that fossil fuels are making climate unlivable.
Truth: If we look at trends, not anecdotes, the drastic decline in extreme weather deaths shows that fossil fuels have made our naturally dangerous climate more livable than ever.6

- Myth: Even if climate-related disaster deaths are down, climate-related damages are way up, pointing to a bankrupting climate future.
Truth: Even though there are many incentives for climate damages to go up—prefs for riskier areas, government bailouts—GDP-adjusted damages are flat.7

- Myth: Even if we’re safe from climate now, we can expect future emissions to lead to disaster.
Truth: Since today’s unprecedented safety exists after over 100 years of rising CO2, and with ~1° C warming, we should be skeptical that further CO2 rises will somehow overwhelm us.
- Myth: Mainstream science shows that rising CO2 is an “existential threat” that will soon cause global catastrophe and then apocalypse.
Truth: Mainstream science shows that rising CO2 levels will lead to levels of warming and other changes that we can master and flourish with.
- Myth: Future warming is ominous because heat-related death is already such a catastrophic problem.
Truth: Even though Earth has gotten 1°C warmer, far more people still die from cold than heat (even in India)! Near-term warming is expected to decrease temperature-related mortality.8

- Myth: Future warming is ominous because it will be worst in hot areas.
Truth: The mainstream view in climate science is that more warming will be concentrated in colder places (Northern latitudes) and at colder times (nighttime) and during colder seasons (winter). Good news.9

- Myth: Future warming will accelerate as CO2 levels rise.
Truth: Mainstream science is unanimous that the “greenhouse effect” is a diminishing effect, with additional CO2 leading to less warning.
Even IPCC’s most extreme, far-fetched scenarios show warming leveling off.10
- Myth: We face catastrophically rapid sea level rises, which will destroy and submerge coastal cities.
Truth: Extreme UN sea level rise projections are just 3 feet in 100 years. Future generations can master that. (We already have 100 million people living below high-tide sea level.)11

- Myth: Hurricane intensity is expected to get catastrophically higher as temperatures rise.
Truth: Mainstream estimates say hurricanes will be less frequent and between 1-10% more intense at 2° C warming. This is not at all catastrophic if we continue our fossil-fueled climate mastery.12

- Myth: Science says that if we hit 1.5 or 2° C warming since the 1800s we face catastrophe followed by apocalypse.
Truth: The 1.5-2° C number is activist fiction. The mastery abilities that have made life far better through 1° C warming will continue to keep us safe.13
Even barely implementing the net-zero agenda has been disastrous.
While COP 28 leaders bemoan how slow their restriction of fossil fuel use in pursuit of net-zero has been, even “slow” restriction has caused a global energy crisis. “Aggressive climate action” = global catastrophe.
- Myth: Net-zero policies are new and exciting.
Truth: Net-zero policies have caused catastrophic energy shortages even with minuscule implementation. Just by slowing the growth of fossil fuel use, not even reducing it, they have caused global energy shortages advocates didn’t warn us of.
- Minuscule net-zero policies causing huge problems:
- US: frequent power shortages (and some disastrous blackouts) after shutting down fossil fuel power plants. E.g., CA
- EU: deadly fossil fuel dependence after restricting domestic fossil fuel industry
- Poor nations: can’t afford fuel due to global restrictions14

- The “net-zero” movement, led by UN COPs, is the root cause of today’s energy crisis because it has restricted
1. fossil fuel investment
2. fossil fuel production
3. fossil fuel transportThis has artificially suppressed fossil fuel supply, leading to high prices and shortages.
- Suppressing fossil fuel investment
For fossil fuel energy to remain low-cost requires sufficient investment. But the COP-led net-zero movement has used government and private entities, often under the banner of “ESG,” to punish and suppress it—meaning less fossil fuel supply.15
- Suppressing fossil fuel production
For fossil fuel energy to remain low-cost for billions of people requires that producers be free to produce it all around the world.
The COP-led net-zero movement has opposed it throughout the world, often successfully, increasing prices.16
- Suppressing fossil fuel transport
For fossil fuels to remain low-cost for billions of people we need to be able to easily transport them from where they are produced to where they are used. But the COP-led net-zero movement has opposed transportation around the world.17
- The “net-zero” movement has rationalized its opposition to fossil fuel investment, production, and transport with claims that solar and wind could rapidly replace fossil fuels.
This has obviously not happened. Despite huge solar and wind subsidies fossil fuel demand has increased.
- Fossil fuels are a uniquely cost-effective source of energy, providing energy that’s low-cost, reliable, versatile, and scalable to billions of people.
That’s why overall fossil fuel use is growing. E.g., China, despite its “net-zero” pledges, has 300 new coal plants in the pipeline.18

- There was never any reason to expect solar and wind to replace fossil fuels. The world needs far more energy—3 billion people still use less electricity than a US refrigerator—so there’s no reason to expect lower demand for any form of cost-effective energy, let alone ultra-versatile fossil fuels.19
- Despite claims that solar and wind are rapidly replacing fossil fuels, they provide less than 5% of world energy—only electricity, ⅕ of energy—and, crucially, even that small percentage depends on huge subsidies and reliable (mostly fossil-fueled) power plants.20
- Solar and wind’s basic problem is unreliability, to the point they can go near zero at any time. Thus they don’t replace reliable power, they parasitize it. This is why they need huge subsidies and why no grid is near 50% solar and wind without parasitism on reliable neighbors.21
- The popular idea that we can use mostly or only solar and wind with sufficient battery backup is not being tried anywhere because it’s absurd. Batteries are so expensive that just 3 days of global backup using Elon Musk’s Megapacks would cost $570 trillion, about 6X global GDP!22

- Scary fact: the “net-zero” movement has caused an energy crisis just by achieving a tiny fraction of its goals. While it has advocated rapidly reducing fossil fuel use, it has only succeeded globally at slowing the growth of fossil fuel use. And even that is catastrophic.
- If just restricting the growth of fossil fuels in a world that needs far more energy is catastrophic, what would it mean to reduce CO2 emissions by the 50% many “climate emergency” advocates want by 2030 and the 100% they want by 2050?
Global misery and premature death.
- The net-zero movement led by COP is particularly dangerous to Africa and other poor regions.
Consider: ⅓ of the world uses wood and animal dung for heating and cooking. 3 billion use less electricity than a typical American refrigerator.
Only fossil fuels can provide the energy they need to develop.23

- Every prosperous country has developed using fossil fuels.
No poor country has been able to develop to the point of prosperity without massive fossil fuel use.
The reason is that development requires energy, and fossil fuels are a uniquely cost-effective, including scalable, source of energy.
- Africa is the world’s poorest region. Most Africans want rapid development and with it, prosperity.
This is absolutely achievable. But only by using the proven practices every once-poor place has used to develop and prosper.
One such practice is large-scale fossil fuel use.
- In recent decades China and India have used large amounts of low-cost, reliable energy from fossil fuels to rapidly develop.
Since 1980, India’s fossil fuel use has increased by >700% and China’s by >600%.
India’s life expectancy increased by 17 years and China’s by 14!24

- Fossil fuels are so uniquely good at providing low-cost, reliable energy for developing nations that even nations with little or no fossil fuel resources have used fossil fuels to develop and prosper. E.g. South Korea (83% fossil fuels), Japan (85% fossil fuels), Singapore (99% fossil fuels).25

- The obvious path for African development and prosperity is to use fossil fuel whenever it’s the most cost-effective option, which is most of the time, and certainly to responsibly produce the significant fossil fuel resources that exist in Africa.
Yet COP tells Africa to forego fossil fuels.
- Given that every prosperous place on Earth has depended on and continues to depend on massive fossil fuel use, and that attempts to replace fossil fuels with solar and wind are failing, the push for Africa to adopt net-zero—aka fossil fuel elimination—is a death sentence for African development.
The alternative to the unnecessary and destructive COPs: energy freedom conferences
Instead of focusing on rapidly eliminating fossil fuel use, we should focus on rapidly liberating energy production and use of all kinds of energy via energy freedom policies.
- What are “energy freedom policies”?
Government actions to protect the ability of producers to produce all forms of energy and consumers to use all forms of energy, so long as they don’t engage in reasonably preventable pollution or endangerment of others.
- Energy freedom policies include:
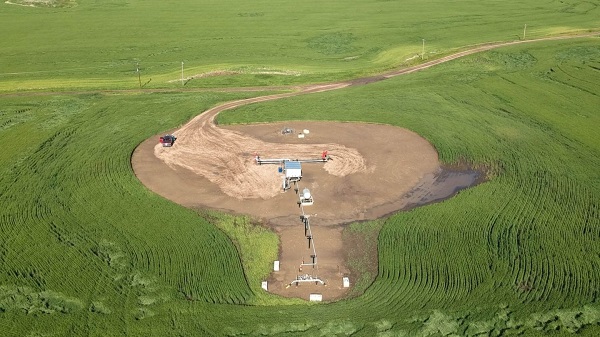
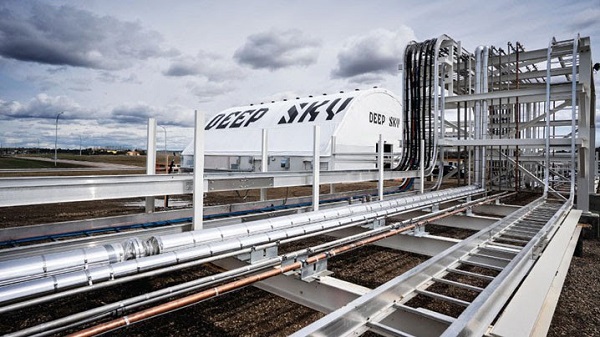
- Protecting the freedom to develop fossil fuels and other forms of energy. E.g., deep geothermal development.
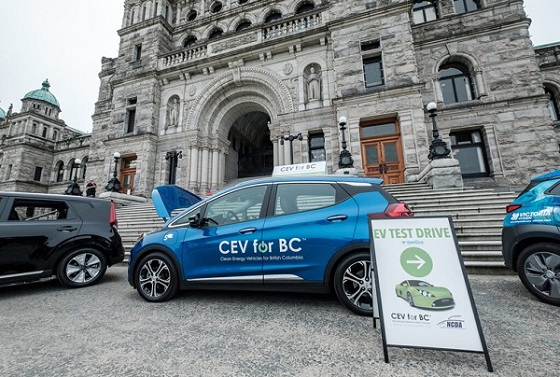
- Protecting the freedom to use fossil fuels and all other forms of energy. E.g., decriminalizing nuclear.
- Energy freedom policies are more likely to lead to long-term emissions reductions, because they accelerate the rate at which nuclear and other alternatives become globally cost-competitive. (The only moral and practical way to reduce global emissions.)26

- Fact: the 2 biggest instances of CO2 reduction have come from energy freedom policies:
- Nuclear: Freedom led to cost-effective and scalable nuclear power until the “green” movement virtually criminalized it.
- Gas: Freedom led to significant substitution of gas vs. coal.
- Alternative energy policy has been dominated by the “green energy” movement, which is an outgrowth of the anti-development green movement. This movement is hostile to all development because of development’s impact on nature, and therefore is hostile to every form of cost-effective energy.
- COP’ leaders’ enthusiastic support for solar and wind is phony. Just as they oppose fossil fuels, nuclear, and hydro for their impact, in practice they oppose the massive mining, construction, and transmission-line-building “green energy” requires.27
- The obvious path forward for the world is energy freedom: the freedom to produce and use all cost-effective sources of energy—including, essentially, fossil fuels—which means rejecting all net-zero targets.
We need courageous leaders who will withdraw from the Paris Agreement.
PS Here’s my friend Jusper Machogu’s message to COP.