Canadian Energy Centre
Canadian energy producers among worlds’ best at limiting gas flaring
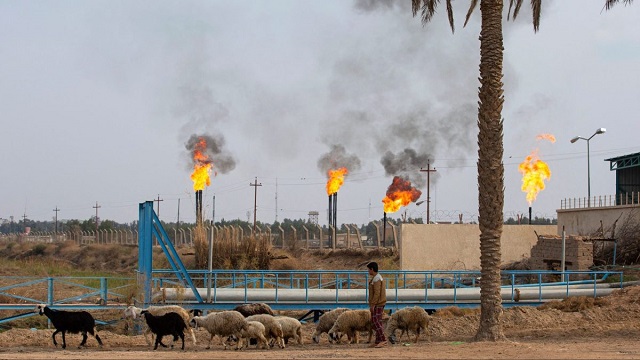
The Nahr Bin Omar oil field and facility near Iraq’s southern port city of Basra on February 11, 2022. In the oilfields of southern Iraq, billions of cubic feet of gas literally go up in smoke, burnt off on flare stacks for want of the infrastructure to capture and process it. (Photo by HUSSEIN FALEH/AFP via Getty Images)
From the Canadian Energy Centre
International comparisons of gas flaring among top oil producers
Canada contributed just 0.7% of the global amount of gas flaring despite being the world’s fourth-largest oil producer
By Ven Venkatachalam and Lennie Kaplan
This Fact Sheet analyzes the upstream oil industry’s record on flaring in Canada relative to other top oil-producing countries. Gas flaring is the burning off of the natural gas that is generated in the process of oil extraction and production. Flaring is relevant because it is a source of greenhouse gas emissions (GHGs) (see Appendix).
In 2022, 138,549 million cubic meters (m3) (or 139 billion cubic meters (bcm)) of flared gases were emitted worldwide, creating 350 million tonnes of CO2 emissions annually. Canada is a significant oil producer; it has the third-largest proven crude oil reserves and is the fourthlargest crude oil producer in the world (Natural Resources Canada, undated), and so contributes to flaring.
Flaring comparisons
This Fact Sheet uses World Bank data to provide international comparisons of flaring. It also draws on U.S. Energy Information Administration (EIA) crude oil production data to compare flaring among the top 10 crude oil producing countries.
Table 1 shows gas flaring volumes in 2012 and 2022. In absolute terms, Russia recorded more flaring than any other country at 25,495 million m3 (25.4 bcm) in 2022, which was 1,628 million m3 (7 per cent) higher than in 2012.
The four countries that are the top GHG emitters through flaring (Russia, Iraq, Iran, and Algeria) accounted for 50 per cent of global gas flaring in 2022.
At 945 million m3, Canada was the eighth lowest flarer in 2022 (23rd spot out of the top 30 countries). It decreased its flaring emissions by 320 million m3 from the 2012 level of 1,264 million m3, a 25 per cent drop.
In 2022, Canada contributed just 0.7 per cent of the global amount of gas flaring despite being the world’s fourth largest oil producer (see Table 1).

Sources: World Bank (undated)
Flaring declined worldwide between 2012 and 2022
Figure 1 shows the change in flaring volumes between 2012 and 2022. Nine countries flared more in 2022 than in 2012, while 21 countries flared less. In the last decade, the global flaring volume decreased by 3 per cent.
- The three countries that most significantly increased flaring between 2012 and 2022 were the Republic of the Congo (65 per cent), Iran (56 per cent), and Iraq (41 per cent).
- The three countries that most significantly decreased flaring between 2012 and 2022 were Uzbekistan (-76 per cent), Columbia (-75 per cent) and Kazakhstan (-74 per cent).
- As noted earlier, flaring fell by 25 per cent in Canada between 2012 and 2022.

Sources: World Bank (undated)
Comparing flaring to increased production
The decreases in flaring in Canada between 2012 and 2022 shown in Table 1 and Figure 1 understate the magnitude of the decline in flaring in the country. That is because Canada’s crude oil production increased by 45 per cent in that period, even as absolute flaring decreased by 25 per cent (see Table 2).
Canada compares very favourably with the United States, which increased crude oil production by 82 per cent and decreased flaring by 16 per cent.

Sources: World Bank (undated) and EIA (2023)
Largest oil producers and flaring intensity
To fully grasp how much more effective Canada has been than many other oil producers in reducing flaring, Table 3 compares both flaring intensity (gas flared per unit of oil production) and crude oil production among the top 10 oil producing countries (which account for 73 per cent of the world oil production).
Canada is the fourth-largest producer of crude oil, and its gas flaring intensity declined by 48 per cenft between 2012 and 2022. Four of the top 10 oil producers witnessed their flaring intensity increase between 2012 and 2022.

Sources: World Bank (undated) and EIA (2023)
Conclusion
Gas flaring contributes to greenhouse gas emissions. However, it is possible for countries to both increase their oil production and still reduce flaring. Canada is one noteworthy example of a country that has significantly reduced flaring not only compared to its increased production of crude oil, but also in absolute terms.
Appendix
Background
Flaring and venting are two ways in which an oil or natural gas producer can dispose of waste gases. Venting is the intentional controlled release of uncombusted gases directly to the atmosphere, and flaring is combusting natural gas or gas derived from petroleum in order to dispose of it.¹ As Matthew R. Johnson and Adam R. Coderre noted in their 2012 paper on the subject, flaring in the petroleum industry generally falls within three broad categories:
- Emergency flaring (large, unplanned, and very short-duration releases, typically at larger downstream facilities or off-shore platforms);
- Process flaring (intermittent large or small releases that may last for a few hours or a few days as occurs in the upstream industry during well-test flaring to assess the size of a reservoir or at a downstream plant during a planned process blowdown); and
- Production flaring (may occur continuously for years while oil is being produced).
To track GHGs from flaring and venting, Environment Canada (2016) defines such emissions as:
- Fugitive emissions: Unintentional releases from venting, flaring, or leakage of gases from fossil fuel production and processing, iron and steel coke oven batteries, or CO2 capture, transport, injection, and storage infrastructure.
- Flaring emissions: Controlled releases of gases from industrial activities from the combustion of a gas or liquid stream produced at a facility, the purpose of which is not to produce useful heat or work. This includes releases from waste petroleum incineration, hazardous emission prevention systems, well testing, natural gas gathering systems, natural gas processing plant operations, crude oil production, pipeline operations, petroleum refining, chemical fertilizer production, and steel production.
- Venting emissions: Controlled releases of a process or waste gas, including releases of CO2 associated with carbon capture, transport, injection, and storage; from hydrogen production associated with fossil fuel production and processing; of casing gas; of gases associated with a liquid or a solution gas; of treater, stabilizer, or dehydrator off-gas; of blanket gases; from pneumatic devices that use natural gas as a driver; from compressor start-ups, pipelines, and other blowdowns; and from metering and regulation station control loops.
1. Many provinces regulate flaring and venting including Alberta (Directive 060) British Columbia (Flaring and Venting Reduction Guideline), and Saskatchewan (S-10 and S-20). Newfoundland & Labrador also has regulations that govern offshore flaring.
Notes
This CEC Fact Sheet was compiled by Ven Venkatachalam and Lennie Kaplan at the Canadian Energy Centre: www.canadianenergycentre.ca. All percentages in this report are calculated from the original data, which can run to multiple decimal points. They are not calculated using the rounded figures that may appear in charts and in the text, which are more reader friendly. Thus, calculations made from the rounded figures (and not the more precise source data) will differ from the more statistically precise percentages we arrive at using source data. The authors and the Canadian Energy Centre would like to thank and acknowledge the assistance of an anonymous reviewer in reviewing the data and research for this Fact Sheet.
References (All links live as of September 23, 2023)
Alberta Energy Regulator (2022), Directive 060: Upstream Petroleum Industry Faring, Incinerating, and Venting <https://bit.ly/3AMYett>; BC Oil and Gas Commission (2021), Flaring and Venting Reduction Guideline, version 5.2 <https://bit.ly/3CWRa0i>; Canada-Newfoundland and Labrador Offshore Petroleum Board (2007), Offshore Newfoundland and Labrador Gas Flaring Reduction <https://bit.ly/3RhKpKu>; D&I Services (2010), Saskatchewan Energy and Resources: S-10 and S-20 <https://bit.ly/3TBrVGJ>; Johnson, Matthew R., and Adam R. Coderre (2012), Compositions and Greenhouse Gas Emission Factors of Flared and Vented Gas in the Western Canadian Sedimentary Basin, Journal of the Air & Waste Management Association 62, 9: 992-1002 <https://bit.ly/3cJRqPd>; Environment Canada (2016), Technical Guidance on Reporting Greenhouse Gas Emissions/Facility Greenhouse Gas Emissions Reporting Program <https://bit.ly/3CVQR5C>; Natural Resources Canada (Undated), Oil Resources <https://bit.ly/3oWWhW0>; U.S. Energy Information Administration (undated), Petroleum and Other Liquids <https://bit.ly/2Ad6S9i>; World Bank (Undated), Global Gas Flaring Data <https://bit.ly/3zXuxGX>.
Canadian Energy Centre
Cross-Canada economic benefits of the proposed Northern Gateway Pipeline project
From the Canadian Energy Centre
Billions in government revenue and thousands of jobs across provinces
Announced in 2006, the Northern Gateway project would have built twin pipelines between Bruderheim, Alta. and a marine terminal at Kitimat, B.C.
One pipeline would export 525,000 barrels per day of heavy oil from Alberta to tidewater markets. The other would import 193,000 barrels per day of condensate to Alberta to dilute heavy oil for pipeline transportation.
The project would have generated significant economic benefits across Canada.

The following projections are drawn from the report Public Interest Benefits of the Northern Gateway Project (Wright Mansell Research Ltd., July 2012), which was submitted as reply evidence during the regulatory process.
Financial figures have been adjusted to 2025 dollars using the Bank of Canada’s Inflation Calculator, with $1.00 in 2012 equivalent to $1.34 in 2025.
Total Government Revenue by Region
Between 2019 and 2048, a period encompassing both construction and operations, the Northern Gateway project was projected to generate the following total government revenues by region (direct, indirect and induced):

British Columbia
- Provincial government revenue: $11.5 billion
- Federal government revenue: $8.9 billion
- Total: $20.4 billion
Alberta
- Provincial government revenue: $49.4 billion
- Federal government revenue: $41.5 billion
- Total: $90.9 billion
Ontario
- Provincial government revenue: $1.7 billion
- Federal government revenue: $2.7 billion
- Total: $4.4 billion
Quebec
- Provincial government revenue: $746 million
- Federal government revenue: $541 million
- Total: $1.29 billion
Saskatchewan
- Provincial government revenue: $6.9 billion
- Federal government revenue: $4.4 billion
- Total: $11.3 billion
Other
- Provincial government revenue: $1.9 billion
- Federal government revenue: $1.4 billion
- Total: $3.3 billion
Canada
- Provincial government revenue: $72.1 billion
- Federal government revenue: $59.4 billion
- Total: $131.7 billion
Annual Government Revenue by Region
Over the period 2019 and 2048, the Northern Gateway project was projected to generate the following annual government revenues by region (direct, indirect and induced):

British Columbia
- Provincial government revenue: $340 million
- Federal government revenue: $261 million
- Total: $601 million per year
Alberta
- Provincial government revenue: $1.5 billion
- Federal government revenue: $1.2 billion
- Total: $2.7 billion per year
Ontario
- Provincial government revenue: $51 million
- Federal government revenue: $79 million
- Total: $130 million per year
Quebec
- Provincial government revenue: $21 million
- Federal government revenue: $16 million
- Total: $37 million per year
Saskatchewan
- Provincial government revenue: $204 million
- Federal government revenue: $129 million
- Total: $333 million per year
Other
- Provincial government revenue: $58 million
- Federal government revenue: $40 million
- Total: $98 million per year
Canada
- Provincial government revenue: $2.1 billion
- Federal government revenue: $1.7 billion
- Total: $3.8 billion per year
Employment by Region
Over the period 2019 to 2048, the Northern Gateway Pipeline was projected to generate the following direct, indirect and induced full-time equivalent (FTE) jobs by region:

British Columbia
- Annual average: 7,736
- Total over the period: 224,344
Alberta
- Annual average: 11,798
- Total over the period: 342,142
Ontario
- Annual average: 3,061
- Total over the period: 88,769
Quebec
- Annual average: 1,003
- Total over the period: 29,087
Saskatchewan
- Annual average: 2,127
- Total over the period: 61,683
Other
- Annual average: 953
- Total over the period: 27,637
Canada
- Annual average: 26,678
- Total over the period: 773,662
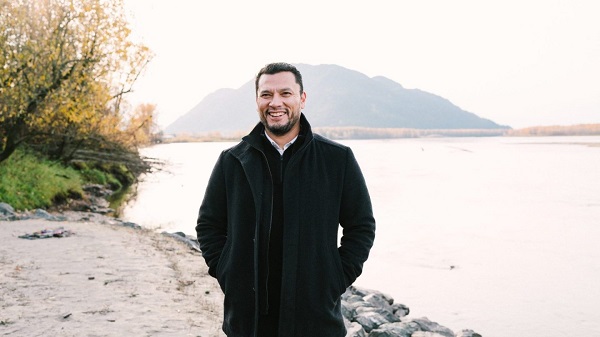
Chief David Jimmie is president of Stonlasec8 and Chief of Squiala First Nation in B.C. He also chairs the Western Indigenous Pipeline Group. Photo courtesy Western Indigenous Pipeline Group
From the Canadian Energy Centre
Stonlasec8 agreement is Canada’s first federal Indigenous loan guarantee
The first federally backed Indigenous loan guarantee paves the way for increased prosperity for 36 First Nations communities in British Columbia.
In May, Canada Development Investment Corporation (CDEV) announced a $400 million backstop for the consortium to jointly purchase 12.5 per cent ownership of Enbridge’s Westcoast natural gas pipeline system for $712 million.
In the works for two years, the deal redefines long-standing relationships around a pipeline that has been in operation for generations.
“For 65 years, there’s never been an opportunity or a conversation about participating in an asset that’s come through the territory,” said Chief David Jimmie of the Squiala First Nation near Vancouver, B.C.
“We now have an opportunity to have our Nation’s voices heard directly when we have concerns and our partners are willing to listen.”
Jimmie chairs the Stonlasec8 Indigenous Alliance, which represents the communities buying into the Enbridge system.
The name Stonlasec8 reflects the different regions represented in the agreement, he said.
The Westcoast pipeline stretches more than 2,900 kilometres from northeast B.C. near the Alberta border to the Canada-U.S. border near Bellingham, Wash., running through the middle of the province.

It delivers up to 3.6 billion cubic feet per day of natural gas throughout B.C. and the Lower Mainland, Alberta and the U.S. Pacific Northwest.
“While we see the benefits back to communities, we are still reminded of our responsibility to the land, air and water so it is important to think of reinvestment opportunities in alternative energy sources and how we can offset the carbon footprint,” Jimmie said.
He also chairs the Western Indigenous Pipeline Group (WIPG), a coalition of First Nations communities working in partnership with Pembina Pipeline to secure an ownership stake in the newly expanded Trans Mountain pipeline system.
There is overlap between the communities in the two groups, he said.
CDEV vice-president Sébastien Labelle said provincial models such as the Alberta Indigenous Opportunities Corporation (AIOC) and Ontario’s Indigenous Opportunities Financing Program helped bring the federal government’s version of the loan guarantee to life.
“It’s not a new idea. Alberta started it before us, and Ontario,” Labelle said.
“We hired some of the same advisors AIOC hired because we want to make sure we are aligned with the market. We didn’t want to start something completely new.”
Broadly, Jimmie said the Stonlasec8 agreement will provide sustained funding for investments like housing, infrastructure, environmental stewardship and cultural preservation. But it’s up to the individual communities how to spend the ongoing proceeds.
The long-term cash injections from owning equity stakes of major projects can provide benefits that traditional funding agreements with the federal government do not, he said.
Labelle said the goal is to ensure Indigenous communities benefit from projects on their traditional territories.
“There’s a lot of intangible, indirect things that I think are hugely important from an economic perspective,” he said.
“You are improving the relationship with pipeline companies, you are improving social license to do projects like this.”
Jimmie stressed the impact the collaborative atmosphere of the negotiations had on the success of the Stonlasec8 agreement.
“It takes true collaboration to reach a successful partnership, which doesn’t always happen. And from the Nation representation, the sophistication of the group was one of the best I’ve ever worked with.”
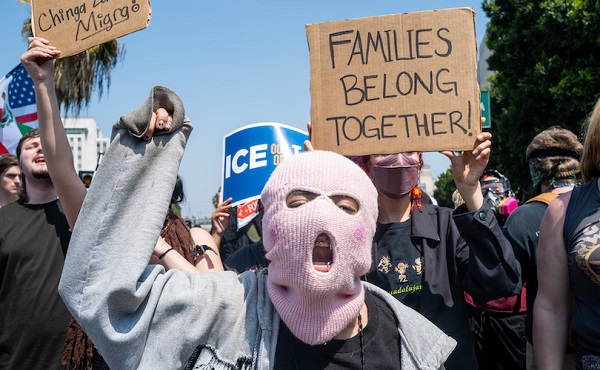
Anti-Trump protests planned across the country on Saturday as LA violence continues

FBI Director: CCP Behind Wave of Pathogen Smuggling as Third Chinese Student Charged in Michigan Lab Probe

Telegram founder Pavel Durov exposes crackdown on digital privacy in Tucker Carlson interview

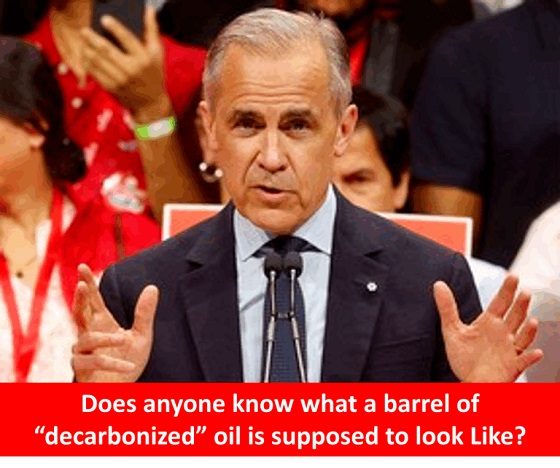
Carney’s Promise of Expediting Resource Projects Feels Like a Modern Version of the Wicked Stepmother from Disney’s Cinderella
-
 conflict2 days ago
Iran nuclear talks were ‘coordinated deception’ between US and Israel: report
-
 Alberta2 days ago
Punishing Alberta Oil Production: The Divisive Effect of Policies For Carney’s “Decarbonized Oil”
-
 Energy2 days ago
Canada is no energy superpower
-
 Health2 days ago
Just 3 Days Left to Win the Dream Home of a Lifetime!
-
 Alberta2 days ago
Alberta Premier Danielle Smith Discusses Moving Energy Forward at the Global Energy Show in Calgary
-
 Fraser Institute2 days ago
Long waits for health care hit Canadians in their pocketbooks
-
 conflict1 day ago
One dead, over 60 injured after Iranian missiles pierce Iron Dome
-
 Crime2 hours ago
Manhunt on for suspect in shooting deaths of Minnesota House speaker, husband