Business
Ottawa’s avalanche of spending hasn’t helped First Nations

From the Fraser Institute
By Tom Flanagan
When Justin Trudeau came to power in 2015, he memorably said that the welfare of Indigenous Canadians was his highest priority. He certainly has delivered on his promise, at least in terms of shovelling out money.
During his 10 years in office, budgeted Indigenous spending has approximately tripled, from about $11 billion to almost $33 billion. Prime Minister Trudeau’s instruction to the Department of Justice to negotiate rather than litigate class actions has resulted in paying tens of billions of dollars to Indigenous claimants over alleged wrongs in education and other social services. And his government has settled specific claims—alleged violations of treaty terms or of the Indian Act—at four times the previous rate, resulting in the award of at least an additional $10 billion to First Nations government.
But has this avalanche of money really helped First Nations people living on reserves, who are the poorest segment of Canadian society?
One indicator suggests the answer is yes. The gap between reserves and other communities—as measured by the Community Well-Being Index (CWB), a composite of income, employment, housing and education—fell from 19 to 16 points from 2016 to 2021. But closer analysis shows that the reduction in the gap, although real, cannot be due to the additional spending described above.
The gain in First Nations CWB is due mainly to an increase in the income component of the CWB. But almost all of the federal spending on First Nations, class-action settlements and specific claims do not provide taxable income to First Nations people. Rather, the increase in income documented by the CWB comes from the greatly increased payments legislated by the Liberals in the form of the Canada Child Benefit (CCB). First Nations people have a higher birth rate than other Canadians, so they have more children and receive more (on average) from the Canada Child Benefit. Also, they have lower income on average than other Canadians, so the value of the CCB is higher than comparable non-Indigenous families. The result? A gain in income relative to other Canadians, and thus a narrowing of the CWB gap between First Nations and other communities.
There’s an important lesson here. Tens of billions in additional budgetary spending and legal settlements did not move the needle. What did lead to a measurable improvement was legislation creating financial benefits for all eligible Canadian families with children regardless of race. Racially inspired policies are terrible for many reasons, especially because they rarely achieve their goals in practise. If we want to improve life for First Nations people, we should increase opportunities for Canadians of all racial backgrounds and not enact racially targeted policies.
Moreover, racial policies are also fraught with unintended consequences. In this case, the flood of federal money has made First Nations more dependent rather than less dependent on government. In fact, from 2018 to 2022, “Own Source Revenue” (business earnings plus property taxes and fees) among First Nations bands increased—but not as much as transfers from government. The result? Greater dependency on government transfers.
This finding is not just a statistical oddity. Previous research has shown that First Nations who are relatively less dependent on government transfers tend to achieve higher living standards (again, as measured by the CWB index). Thus, the increase in dependency presided over by the Trudeau government does not augur well for the future.
One qualification: this finding is not as robust as I would like because the number of band governments filing reports on their finances has drastically declined. Of 630 First Nation governments, only 260 filed audited statements for fiscal 2022. All First Nations are theoretically obliged by the First Nations Financial Transparency Act, 2013, to publish such statements, but the Trudeau government announced there would be no penalties for non-compliance, leading to a precipitous decline in reporting.
This is a shame, because First Nations, as they often insist, are governments, not private organizations. And like other governments, they should make their affairs visible to the public. Also, most of their income comes from Canadian taxpayers. Both band members and other Canadians have a right to know how much money they receive, how it’s being spent and whether it’s achieving its intended goals.
Author:


From the Fraser Institute
By Nadeem Esmail and Mackenzie Moir
It’s an exciting time in Canadian health-care policy. But even the slew of new reforms in Alberta only go part of the way to using all the policy tools employed by high performing universal health-care systems.
For 2026, for the sake of Canadian patients, let’s hope Alberta stays the path on changes to how hospitals are paid and allowing some private purchases of health care, and that other provinces start to catch up.
While Alberta’s new reforms were welcome news this year, it’s clear Canada’s health-care system continued to struggle. Canadians were reminded by our annual comparison of health care systems that they pay for one of the developed world’s most expensive universal health-care systems, yet have some of the fewest physicians and hospital beds, while waiting in some of the longest queues.
And speaking of queues, wait times across Canada for non-emergency care reached the second-highest level ever measured at 28.6 weeks from general practitioner referral to actual treatment. That’s more than triple the wait of the early 1990s despite decades of government promises and spending commitments. Other work found that at least 23,746 patients died while waiting for care, and nearly 1.3 million Canadians left our overcrowded emergency rooms without being treated.
At least one province has shown a genuine willingness to do something about these problems.
The Smith government in Alberta announced early in the year that it would move towards paying hospitals per-patient treated as opposed to a fixed annual budget, a policy approach that Quebec has been working on for years. Albertans will also soon be able purchase, at least in a limited way, some diagnostic and surgical services for themselves, which is again already possible in Quebec. Alberta has also gone a step further by allowing physicians to work in both public and private settings.
While controversial in Canada, these approaches simply mirror what is being done in all of the developed world’s top-performing universal health-care systems. Australia, the Netherlands, Germany and Switzerland all pay their hospitals per patient treated, and allow patients the opportunity to purchase care privately if they wish. They all also have better and faster universally accessible health care than Canada’s provinces provide, while spending a little more (Switzerland) or less (Australia, Germany, the Netherlands) than we do.
While these reforms are clearly a step in the right direction, there’s more to be done.
Even if we include Alberta’s reforms, these countries still do some very important things differently.
Critically, all of these countries expect patients to pay a small amount for their universally accessible services. The reasoning is straightforward: we all spend our own money more carefully than we spend someone else’s, and patients will make more informed decisions about when and where it’s best to access the health-care system when they have to pay a little out of pocket.
The evidence around this policy is clear—with appropriate safeguards to protect the very ill and exemptions for lower-income and other vulnerable populations, the demand for outpatient healthcare services falls, reducing delays and freeing up resources for others.
Charging patients even small amounts for care would of course violate the Canada Health Act, but it would also emulate the approach of 100 per cent of the developed world’s top-performing health-care systems. In this case, violating outdated federal policy means better universal health care for Canadians.
These top-performing countries also see the private sector and innovative entrepreneurs as partners in delivering universal health care. A relationship that is far different from the limited individual contracts some provinces have with private clinics and surgical centres to provide care in Canada. In these other countries, even full-service hospitals are operated by private providers. Importantly, partnering with innovative private providers, even hospitals, to deliver universal health care does not violate the Canada Health Act.
So, while Alberta has made strides this past year moving towards the well-established higher performance policy approach followed elsewhere, the Smith government remains at least a couple steps short of truly adopting a more Australian or European approach for health care. And other provinces have yet to even get to where Alberta will soon be.
Let’s hope in 2026 that Alberta keeps moving towards a truly world class universal health-care experience for patients, and that the other provinces catch up.


If you think the CCP will treat foreigners better than its own people, when it extends its power over you, please think again: Dimon Liu’s warning to Canadian Parliament.
Editor’s Note: The Bureau is publishing the following testimony to Canada’s House of Commons committee on International Human Rights from Dimon Liu, a China-born, Washington, D.C.-based democracy advocate who testified in Parliament on December 8, 2025, about the human cost of China’s economic rise. Submitted to The Bureau as an op-ed, Liu’s testimony argues that the Canadian government should tighten scrutiny of high-risk trade and investment, and ensure Canada’s foreign policy does not inadvertently reward coercion. Liu also warns that the Chinese Communist Party could gain leverage over Canadians and treat them as it has done to its own subjugated population—an implied message to Prime Minister Mark Carney, who has pledged to engage China as a strategic partner without making that position clear to Canadians during his election campaign.
OTTAWA — It is an honor to speak before you at the Canadian Parliament.
My testimony will attempt to explain why China’s economic success is built on the backs of the largest number of displaced persons in human history.
It is estimated that these displaced individuals range between 300 to 400 million — it is equivalent to the total population of the United States being uprooted and forced to relocate. These displaced persons are invisible to the world, their sufferings unnoticed, their plights ignored.
In 1978, when economic reform began, China’s GDP was $150 billion USD.
In 2000, when China joined the WTO, it was approximately $1.2 trillion USD.
China’s current GDP is approximately $18 trillion USD.
In 2000 China’s manufacturing output was smaller than Italy’s.
Today it’s larger than America, Europe, Japan, and South Korea combined.
If you have ever wondered how China managed to grow so fast in such a short time, Charles Li, former CEO of the Hong Kong Stock Exchange, has the answers for you.
He listed 4 reasons: 1) cheapest land, 2) cheapest labor, 3) cheapest capital, and 4) disregard of environmental costs.

“The cheapest land” because the CCP government took the land from the farmers at little to no compensation.
“The cheapest labor,” because these farmers, without land to farm, were forced to find work in urban areas at very low wages.
The communist household registration system (hukou 戶口) ties them perpetually to the rural areas. This means they are not legal residents, and cannot receive social benefits that legal urban residents are entitled. They could be evicted at any time.
One well known incident of eviction occurred in November 2017. Cai Qi, now the second most powerful man in China after Xi Jinping, was a municipal official in Beijing. He evicted tens of thousands into Beijing’s harsh winter, with only days, or just moments of notice. Cai Qi made famous a term, “low-end population” (低端人口), and exposed CCP’s contempt of rural migrants it treats as second class citizens.
These displaced migrant workers have one tradition they hold dear — it is to reunite with their families during the Chinese Lunar New Year holiday, making this seasonal migration of 100 to 150 million people a spectacular event. In China’s economic winter of 2025 with waves of bankruptcies and factory closures, the tide of unemployed migrant workers returning home to where there is also no work, and no land to farm, has become a worrisome event.
Historically in the last 2,000 years, social instability has caused the collapse of many ruling regimes in China.
“The cheapest capital” is acquired through predatory banking practices, and through the stock markets, first to rake in the savings of the Chinese people; and later international investments by listing opaque, and state owned enterprises in leading stock markets around the world.
“A disregard of environmental costs” is a hallmark of China’s industrialization. The land is poisoned, so is the water; and China produces one-third of all global greenhouse gases.
Chinese Communist officials often laud their system as superior. The essayist Qin Hui has written that the Chinese communist government enjoys a human rights abuse advantage. This is true. By abusing its own people so brutally, the CCP regime has created an image of success, which will prove to be a mirage.
If you think the CCP will treat foreigners better than its own people, when it extends its power over you, please think again.
The Bureau is a reader-supported publication.
To receive new posts and support my work, consider becoming a free or paid subscriber.


Argentina’s Milei delivers results free-market critics said wouldn’t work

Australian PM booed at Bondi vigil as crowd screams “shame!”

‘Almost Sounds Made Up’: Jeffrey Epstein Was Bill Clinton Plus-One At Moroccan King’s Wedding, Per Report

There’s No Bias at CBC News, You Say? Well, OK…
-
 Alberta1 day ago
Alberta Next Panel calls to reform how Canada works
-
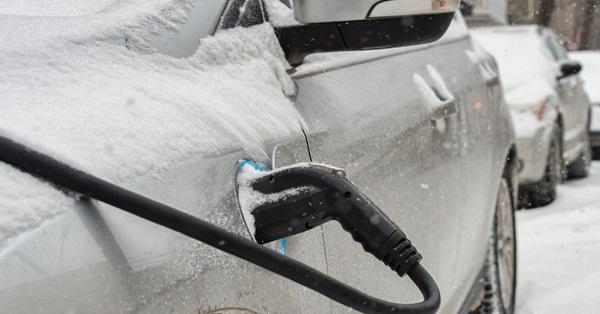 Automotive2 days ago
Canada’s EV gamble is starting to backfire
-
 International6 hours ago
Georgia county admits illegally certifying 315k ballots in 2020 presidential election
-
 Digital ID23 hours ago
Canadian government launches trial version of digital ID for certain licenses, permits
-
 Business22 hours ago
The “Disruptor-in-Chief” places Canada in the crosshairs
-
 Agriculture1 day ago
End Supply Management—For the Sake of Canadian Consumers
-
 Alberta6 hours ago
Calgary’s new city council votes to ban foreign flags at government buildings
-
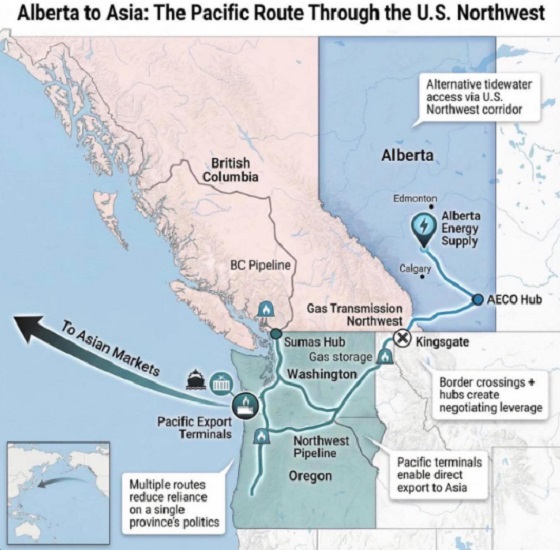 Alberta9 hours ago
What are the odds of a pipeline through the American Pacific Northwest