Energy
One (Megawatt) is the loneliest number, but hundreds of batteries are absurd
From the Frontier Centre for Public Policy
That comes out to $104,000,000,000, in batteries, alone, to cover those 18 hours on Feb. 8. To make it easier on you, $104 billion. If you use Smith’s numbers, it’s $80.6 billion. Even if I’m out by a factor of two, it’s an obscene amount of money.
SaskPower Minister Dustin Duncan recently told me I watch electricity markets like some people watch fantasy football. I would agree with him, if I knew anything about fantasy football.
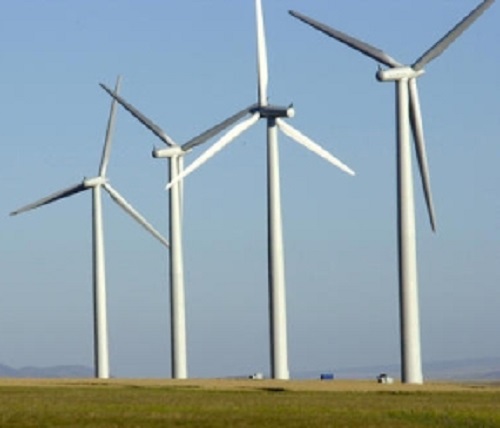
I had some time to kill around noon on Feb. 8, and I checked out the minute-by-minute updates from the Alberta Electric System Operator. What I saw for wind power production was jaw-dropping to say the least. Alberta has built 45 wind farms with hundreds of wind turbines totalling an installed capacity of 4,481 megawatts.
My usual threshold for writing a story about this is output falling to less than one per cent – 45 megawatts. Its output at 11:07 a.m., Alberta time, in megawatts?
“1”
Ten minutes later:
“1”
30 minutes later:
“1”
How long can this last? Is there a fault with the website? There doesn’t seem to be.
12:07 p.m.
“1”
Strains of “One is the loneliest number” flow through my head.
I’ve seen it hit one before briefly. Even zero for a minute or two. But this keeps going. And going. I keep taking screenshots. How long will this last?
1:07 p.m.
“1”
1:29 p.m.
“1”
Finally, there’s a big change at 2:38. The output has doubled.
“2.”
That’s 2.5 hours at one. How long will two last?
3:45 p.m.
“2”
4:10 p.m. – output quadruples – to a whopping eight megawatts.
It ever-so-slowly crept up from there. Ten hours after I started keeping track, total wind output had risen to 39 megawatts – still not even one per cent of rated output. Ten hours.
It turns out that wind fell below one per cent around 5 a.m., and stayed under that for 18 hours.
Building lots of turbines doesn’t work
The argument has long been if it’s not blowing here, it’s blowing somewhere. Build enough turbines, spread them all over, and you should always have at least some wind power. But Alberta’s wind turbines are spread over an area larger than the Benelux countries, and they still had essentially zero wind for 18 hours. Shouldn’t 45 wind farms be enough geographic distribution?
The other argument is to build lots and lots of batteries. Use surplus renewable power to charge them, and then when the wind isn’t blowing (or sun isn’t shining), draw power from the batteries.
Alberta has already built 10 grid-scale batteries. Nine of those are the eReserve fleet, each 20 megawatt Tesla systems. I haven’t been able to find the price of those, but SaskPower is building a 20 megawatt Tesla system on the east side of Regina, and its price is $26 million.
From over a year’s frequent observation, it’s apparent that the eReserve batteries only put out a maximum of 20 megawatts for about an hour before they’re depleted. They can run longer at lower outputs, but I haven’t seen anything to show they could get two or five hours out of the battery at full power. And SaskPower’s press release explains its 20 megawatt Tesla system has about 20 megawatts-hours of power. This corresponds very closely to remarks made by Alberta Premier Danielle Smith, along with the price of about $1 million per megawatt hour for grid-scale battery capacity.
She said in late October, “I want to talk about batteries for a minute, because I know that everybody thinks that this economy is going to be operated on wind and solar and battery power — and it cannot. There is no industrialized economy in the world operating that way, because they need baseload. And, I’ll tell you what I know about batteries, because I talked to somebody thinking of investing in it on a 200-megawatt plant. One million dollars to be able to get each megawatt stored: that’s 200 million dollars for his plant alone, and he would get one hour of storage. So if you want me to have 12 thousand megawatts of storage, that’s 12 billion dollars for one hour of storage, 24 billion dollars for two hours of storage, 36 billion dollars for three hours of storage, and there are long stretches in winter, where we can go weeks without wind or solar. That is the reason why we need legitimate, real solutions that rely on baseload power rather than fantasy thinking.”
So let’s do some math to see if the premier is on the money.
If you wanted enough batteries to output the equivalent of the 4,481 megawatts of wind for one hour (minus the 1 megawatt it was producing), that’s 4480 megawatts / 20 megawatts per battery = 224 batteries like those in the eReserve fleet. But remember, they can only output their full power for about an hour. So the next hour, you need another 224, and so on. For 18 hours, you need 4032 batteries. Let’s be generous and subtract the miniscule wind production over that time, and round it to 4,000 batteries, at $26 million a pop. (Does Tesla offer bulk discounts?)
That comes out to $104,000,000,000, in batteries, alone, to cover those 18 hours on Feb. 8. To make it easier on you, $104 billion. If you use Smith’s numbers, it’s $80.6 billion. Even if I’m out by a factor of two, it’s an obscene amount of money.
But wait, there’s more!
You would also need massive amounts of transmission infrastructure to power and tie in those batteries. I’m not even going to count the dollars for that.
But you also need the surplus power to charge all those batteries. The Alberta grid, like most grids, runs with a four per cent contingency, as regulated by NERC. Surplus power is often sold to neighbours. And there’s been times, like mid-January, where that was violated, resulting in a series of grid alerts.
At times when there’s lots of wind and solar on the grid, there’s up to around 900 megawatts being sold to B.C and other neighbours. But for 18 hours (not days, but hours), you need 4,000 batteries * 20 megawatt-hours per battery = 80,000 megawatt hours. Assuming 100 per cent efficiency in charging (which is against the laws of physics, but work with me here), if you had a consistent 900 megawatts of surplus power, it would take 89 hours to charge them (if they could charge that fast, which is unlikely).
That’s surplus power you are not selling to an external client, meaning you’re not taking in any extra revenue, and they might not be getting the power they need. And having 900 megawatts is the exception here. It’s much more like 300 megawatts surplus. So your perfect 89 hours to charge becomes 267 hours (11.1 days), all to backfill 18 hours of essentially no wind power.
This all assumes at you’ve had sufficient surplus power to charge your batteries, that days or weeks of low wind and/or solar don’t deplete your reserves, and the length of time they are needed does not exceed your battery capacity.
Nor does it figure in how many years life are you going to get out of those batteries in the first place? How many charge cycles before you have to recapitalize the whole fleet?
For the dollars we’re talking here, you’re easily better off to four (or more) Westinghouse AP-1000 reactors, with 1,100 megawatts capacity each. Their uptime should be somewhere around 90 per cent.
Or maybe coal could be renewed – built with the most modern technology like high efficiency, low emissions (HELE), with integrated carbon capture from Day 1. How many HELE coal-fired power plants, with carbon capture and storage, could you build for either $80 billion or $104 billion? Certainly more than 4,481 megawatts worth.
Building either nuclear or HELE coal gives you solid, consistent baseload power, without the worry of the entire fleet going down, like wind did in Alberta on Feb. 8, as well as Feb. 4, 5, 6, and 7.
Indeed, according to X bot account @ReliableAB, which does hourly tracking of the Alberta grid, from Feb. 5 to 11:15 a.m., Feb. 9, Alberta wind output averaged 3.45 per cent of capacity. So now instead of 18 hours, we’re talking 108 hours needing 96+ per cent to be backfilled. I don’t have enough brain power to figure it out.
You can argue we only need to backfill X amount of wind, maybe 25 per cent, since you can’t count on wind to ever produce 100 per cent of its nameplate across the fleet. But Alberta has thousands more megawatts of wind on tap to be built as soon as the province lifts is pause on approvals. If they build all of it, maybe the numbers I provide will indeed be that 25 per cent. Who knows? The point is all of this is ludicrous.
Just build reliable, baseload power, with peaking capacity. And end this foolishness.
Brian Zinchuk is editor and owner of Pipeline Online, and occasional contributor to the Frontier Centre for Public Policy. He can be reached at [email protected].

From the Fraser Institute
Two recent events exemplify the fundamental irrationality that is Canada’s electric vehicle (EV) policy.
First, the Carney government re-committed to Justin Trudeau’s EV transition mandate that by 2035 all (that’s 100 per cent) of new car sales in Canada consist of “zero emission vehicles” including battery EVs, plug-in hybrid EVs and fuel-cell powered vehicles (which are virtually non-existent in today’s market). This policy has been a foolish idea since inception. The mass of car-buyers in Canada showed little desire to buy them in 2022, when the government announced the plan, and they still don’t want them.
Second, President Trump’s “Big Beautiful” budget bill has slashed taxpayer subsidies for buying new and used EVs, ended federal support for EV charging stations, and limited the ability of states to use fuel standards to force EVs onto the sales lot. Of course, Canada should not craft policy to simply match U.S. policy, but in light of policy changes south of the border Canadian policymakers would be wise to give their own EV policies a rethink.
And in this case, a rethink—that is, scrapping Ottawa’s mandate—would only benefit most Canadians. Indeed, most Canadians disapprove of the mandate; most do not want to buy EVs; most can’t afford to buy EVs (which are more expensive than traditional internal combustion vehicles and more expensive to insure and repair); and if they do manage to swing the cost of an EV, most will likely find it difficult to find public charging stations.
Also, consider this. Globally, the mining sector likely lacks the ability to keep up with the supply of metals needed to produce EVs and satisfy government mandates like we have in Canada, potentially further driving up production costs and ultimately sticker prices.
Finally, if you’re worried about losing the climate and environmental benefits of an EV transition, you should, well, not worry that much. The benefits of vehicle electrification for climate/environmental risk reduction have been oversold. In some circumstances EVs can help reduce GHG emissions—in others, they can make them worse. It depends on the fuel used to generate electricity used to charge them. And EVs have environmental negatives of their own—their fancy tires cause a lot of fine particulate pollution, one of the more harmful types of air pollution that can affect our health. And when they burst into flames (which they do with disturbing regularity) they spew toxic metals and plastics into the air with abandon.
So, to sum up in point form. Prime Minister Carney’s government has re-upped its commitment to the Trudeau-era 2035 EV mandate even while Canadians have shown for years that most don’t want to buy them. EVs don’t provide meaningful environmental benefits. They represent the worst of public policy (picking winning or losing technologies in mass markets). They are unjust (tax-robbing people who can’t afford them to subsidize those who can). And taxpayer-funded “investments” in EVs and EV-battery technology will likely be wasted in light of the diminishing U.S. market for Canadian EV tech.
If ever there was a policy so justifiably axed on its failed merits, it’s Ottawa’s EV mandate. Hopefully, the pragmatists we’ve heard much about since Carney’s election victory will acknowledge EV reality.

Kenneth P. Green
Senior Fellow, Fraser Institute

![]()
From the Daily Caller News Foundation
By Audrey Streb
President Donald Trump issued an executive order calling for the end of green energy subsidies by strengthening provisions in the One Big Beautiful Bill Act on Monday night, citing national security concerns and unnecessary costs to taxpayers.
The order argues that a heavy reliance on green energy subsidies compromise the reliability of the power grid and undermines energy independence. Trump called for the U.S. to “rapidly eliminate” federal green energy subsidies and to “build upon and strengthen” the repeal of wind and solar tax credits remaining in the reconciliation law in the order, directing the Treasury Department to enforce the phase-out of tax credits.
“For too long, the Federal Government has forced American taxpayers to subsidize expensive and unreliable energy sources like wind and solar,” the order states. “Reliance on so-called ‘green’ subsidies threatens national security by making the United States dependent on supply chains controlled by foreign adversaries.”
Dear Readers:
As a nonprofit, we are dependent on the generosity of our readers.
Please consider making a small donation of any amount here.
Thank you!
Former President Joe Biden established massive green energy subsidies under his signature 2022 Inflation Reduction Act (IRA), which did not receive a single Republican vote.
The reconciliation package did not immediately terminate Biden-era federal subsidies for green energy technology, phasing them out over time instead, though some policy experts argued that drawn-out timelines could lead to an indefinite continuation of subsidies. Trump’s executive order alludes to potential loopholes in the bill, calling for a review by Secretary of the Treasury Scott Bessent to ensure that green energy projects that have a “beginning of construction” tax credit deadline are not “circumvented.”
Additionally, the executive order directs the U.S. to end taxpayer support for green energy supply chains that are controlled by foreign adversaries, alluding to China’s supply chain dominance for solar and wind. Trump also specifically highlighted costs to taxpayers, market distortions and environmental impacts of subsidized green energy development in explaining the policy.
Ahead of the reconciliation bill becoming law, Trump told Republicans that “we’ve got all the cards, and we are going to use them.” Several House Republicans noted that the president said he would use executive authority to enhance the bill and strictly enforce phase-outs, which helped persuade some conservatives to back the bill.

COWBOY UP! Pierre Poilievre Promises to Fight for Oil and Gas, a Stronger Military and the Interests of Western Canada

USAID Quietly Sent Thousands Of Viruses To Chinese Military-Linked Biolab

Canada’s euthanasia regime is already killing the disabled. It’s about to get worse
‘Far too serious for such uninformed, careless journalism’: Complaint filed against Globe and Mail article challenging Alberta’s gender surgery law
-
 Bruce Dowbiggin2 days ago
The Covid 19 Disaster: When Do We Get The Apologies?
-
 Crime1 day ago
Sweeping Boston Indictment Points to Vast Chinese Narco-Smuggling and Illegal Alien Labor Plot via Mexican Border
-
 Alberta1 day ago
Alberta school boards required to meet new standards for school library materials with regard to sexual content
-
 Environment1 day ago
EPA releases report on chemtrails, climate manipulation
-
 Business15 hours ago
Trump slaps Brazil with tariffs over social media censorship
-
 International15 hours ago
Support for the Ukraine war continues because no one elected is actually in charge.
-
 Addictions17 hours ago
Can addiction be predicted—and prevented?
-
 Business18 hours ago
CBC six-figure salaries soar