National
Medical Assistance in Dying now accounts for over 4% of deaths in Canada
The following are interesting statistics pulled directly from the:
Fourth annual report on Medical Assistance in Dying in Canada 2022
Growth in the number of medically assisted deaths in Canada continues in 2022.
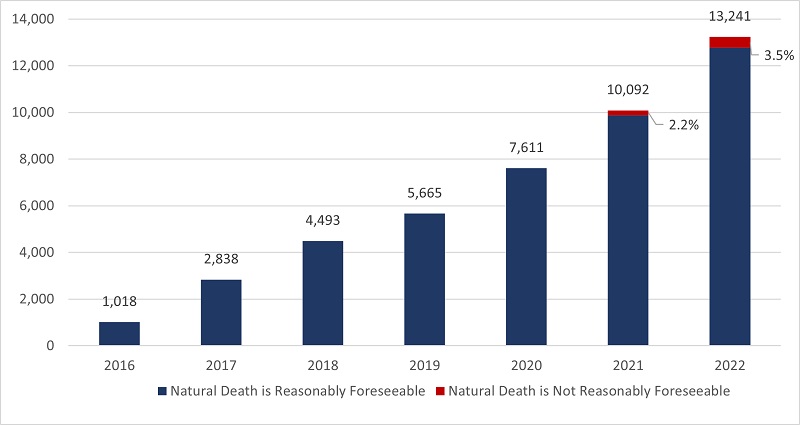
- In 2022, there were 13,241 MAID provisions reported in Canada, accounting for 4.1% of all deaths in Canada.
- The number of cases of MAID in 2022 represents a growth rate of 31.2% over 2021. All provinces except Manitoba and the Yukon continue to experience a steady year-over-year growth in 2022.
- When all data sources are considered, the total number of medically assisted deaths reported in Canada since the introduction of federal MAID legislation in 2016 is 44,958.
Profile of MAID recipients
- In 2022, a slightly larger proportion of males (51.4%) than females (48.6%) received MAID. This result is consistent with 2021 (52.3% males and 47.7% females), 2020 (51.9% males and 48.1% females) and 2019 (50.9% males and 49.1% females).
- The average age of individuals at the time MAID was provided in 2022 was 77.0 years. This average age is slightly higher than the averages of 2019 (75.2), 2020 (75.3) and 2021 (76.3). The average age of females during 2022 was 77.9, compared to males at 76.1.
- Cancer (63.0%) is the most cited underlying medical condition among MAID provisions in 2022, down from 65.6% in 2021 and from a high of 69.1% in 2020. This is followed by cardiovascular conditions (18.8%), other conditions (14.9%), respiratory conditions (13.2%) and neurological conditions (12.6%).
- In 2022, 3.5% of the total number of MAID provisions (463 individuals), were individuals whose natural deaths were not reasonably foreseeable. This is an increase from 2.2% in 2021 (223 individuals). The most cited underlying medical condition for this population was neurological (50.0%), followed by other conditions (37.1%), and multiple comorbidities (23.5%), which is similar to 2021 results. The average age of individuals receiving MAID whose natural death was not reasonably foreseeable was 73.1 years, slightly higher than 70.1 in 2021 but lower than the average age of 77.0 for all MAID recipients in 2022.
Nature of suffering among MAID recipients
- In 2022, the most commonly cited sources of suffering by individuals requesting MAID were the loss of ability to engage in meaningful activities (86.3%), followed by loss of ability to perform activities of daily living (81.9%) and inadequate control of pain, or concern about controlling pain (59.2%).
- These results continue to mirror very similar trends seen in the previous three years (2019 to 2021), indicating that the nature of suffering that leads a person to request MAID has remained consistent over the past four years.
Eligibility Criteria
- Request MAID voluntarily
- 18 years of age or older
- Capacity to make health care decisions
- Must provide informed consent
- Eligible for publicly funded health care services in Canada
- Diagnosed with a “grievous and irremediable medical condition,” where a person must meet all of the following criteria:
- serious and incurable illness, disease or disability
- advanced state of irreversible decline in capability,
- experiencing enduring physical or psychological suffering that is caused by their illness, disease or disability or by the advanced state of decline in capability, that is intolerable to them and that cannot be relieved under conditions that they consider acceptable
- Mental Illness as sole underlying medical condition is excluded until March 17, 2024
3.1 Number of Reported MAID Deaths in Canada (2016 to 2022)
2022 marks six and a half years of access to MAID in Canada. In 2022, there were 13,241 MAID provisions in Canada, bringing the total number of medically assisted deaths in Canada since 2016 to 44,958. In 2022, the total number of MAID provisions increased by 31.2% (2022 over 2021) compared to 32.6% (2021 over 2020). The annual growth rate in MAID provisions has been steady over the past six years, with an average growth rate of 31.1% from 2019 to 2022.

Access to MAID for individuals whose deaths were not reasonably foreseeable marked its second year of eligibility in 2022. In Canada, eligibility for individuals whose death is not reasonably foreseeable began on March 17, 2021, after the passage of the new legislation.Footnote8 There were 463 MAID provisions for persons whose natural death was not reasonably foreseeable, representing 3.5% of all MAID deaths in 2022. This is just over twice the total number of provisions for individuals where natural death was not reasonably foreseeable in 2021 (223 provisions representing 2.2% of all MAID provisions in 2021). Table 3.1 represents total MAID provisions in Canada from 2016 to 2022, including provisions for individuals where natural death was not reasonably foreseeable.
All jurisdictions, except Manitoba and Yukon, experienced growth in MAID provisions in 2022. The highest percentage year over year increases occurred in Québec (45.5%), Alberta (40.7%), Newfoundland and Labrador (38.5%), Ontario (26.8%) and British Columbia (23.9%). Nova Scotia (11.8%), Prince Edward Island (7.3%) and Saskatchewan (4.0%) had lower growth rates. The Yukon remained at the same level as 2021, while Manitoba was the only jurisdiction to experience a decline in MAID provisions for 2022 (-9.0%).
| MAID | NL | PE | NS | NB | QC | ON | MB | SK | AB | BC | YT | NT | NU | Canada |
|---|---|---|---|---|---|---|---|---|---|---|---|---|---|---|
| 2016 | – | – | 24 | 9 | 494 | 191 | 24 | 11 | 63 | 194 | – | – | – | 1,018 |
| 2017 | – | – | 62 | 49 | 853 | 839 | 63 | 57 | 205 | 677 | – | – | – | 2,838 |
| 2018 | 23 | 8 | 126 | 92 | 1,249 | 1,500 | 138 | 85 | 307 | 951 | 12 | – | – | 4,493 |
| 2019 | 20 | 20 | 147 | 141 | 1,604 | 1,788 | 177 | 97 | 377 | 1,280 | 13 | – | – | 5,665 |
| 2020 | 49 | 37 | 190 | 160 | 2,278 | 2,378 | 214 | 160 | 555 | 1,572 | 13 | – | – | 7,611 |
| 2021 | 65 | 41 | 245 | 205 | 3,299 | 3,102 | 245 | 247 | 594 | 2,030 | 16 | – | – | 10,092 |
| 2022 | 90 | 44 | 274 | 247 | 4,801 | 3,934 | 223 | 257 | 836 | 2,515 | 16 | – | – | 13,241 |
| TOTAL 2016-2022 |
267 | 156 | 1,068 | 903 | 14,578 | 13,732 | 1,084 | 914 | 2,937 | 9,219 | 84 | – | – | 44,958 |
3.2 MAID Deaths as a Proportion of Total Deaths in Canada
MAID deaths accounted for 4.1% of all deaths in Canada in 2022, an increase from 3.3% in 2021, 2.5% in 2020 and 2.0% in 2019. In 2022, six jurisdictions continue to experience increases in the number of MAID provisions as a percentage of total deaths, ranging from a low of 1.5% (Newfoundland & Labrador) to a high of 6.6% (Québec). MAID deaths as a percentage of total deaths remained at the same levels as 2021 for Prince Edward Island, Nova Scotia, and Saskatchewan, while Manitoba experienced a decline in MAID deaths as a percentage of all deaths (from 2.1% in 2021 to 1.8% in 2022). As with each of the three previous years (2019 to 2021), Québec and British Columbia experienced the highest percentage of MAID deaths as a proportion of all deaths within their jurisdiction in 2022 (6.6% and 5.5% respectively), continuing to reflect the socio-political dynamics of these two jurisdictions in the context of MAID.
4.5 Profile of Persons Receiving MAID Whose Natural Death is not Reasonably Foreseeable
2022 marks the second year that MAID for persons whose natural death is not reasonably foreseeable is permitted under the law if all other eligibility criteria are met (Table 1.1). New federal MAID legislation passed on March 17, 2021, created a two-track approach to procedural safeguards for MAID practitioners to follow, based on whether or not a person’s natural death is reasonably foreseeable. This approach to safeguards ensures that sufficient time and expertise are spent assessing MAID requests from persons whose natural death is not reasonably foreseeable. New and enhanced safeguards (Table 1.2), including a minimum 90-day assessment period, seek to address the diverse source of suffering and vulnerability that could potentially lead a person who is not nearing death to ask for MAID and to identify alternatives to MAID that could reduce suffering.
In 2022, 3.5% of MAID recipients (463 individuals) were assessed as not having a reasonably foreseeable natural death, up slightly from 2.2% (223 individuals) in 2021. As a percentage of all MAID deaths in Canada, MAID for individuals whose natural death is not reasonably foreseeable represents just 0.14% of all deaths in Canada in 2022 (compared to all MAID provisions, which represent 4.1% of all 2022 deaths in Canada). The proportion of MAID recipients whose natural death was not reasonably foreseeable continues to remain very small compared to the total number of MAID recipients.
This population of individuals whose natural death was not reasonably foreseeable have a different medical profile than individuals whose death was reasonably foreseeable. As shown in Chart 4.5A, the main underlying medical condition reported in the population whose natural death was not reasonably foreseeable was neurological (50.0%), followed by ‘other condition’ (37.1%), and multiple comorbidities (23.5%). This differs from the main condition (as reported in Chart 4.1A) for all MAID recipients in 2022, where the majority of persons receiving MAID had cancer as a main underlying medical condition (63.0%), followed by cardiovascular conditions (18.8%) and other conditions (14.9%) (such as chronic pain, osteoarthritis, frailty, fibromyalgia, autoimmune conditions). These results are similar to 2021.

Of the MAID provisions for individuals where death was reasonably foreseeable, the majority were individuals ages 71 and older (71.1%) while only 28.9% were between ages 18-70. A similar trend was observed for individuals where natural death was not reasonably foreseeable which also showed a greater percentage of individuals who received MAID being 71 and older (58.5%) and a lower number of MAID provisions for individuals between 18-70 years (41.5%). Overall, however, MAID provisions for individuals whose death is not reasonably foreseeable tended to be in the younger age categories than those where natural death is foreseeable.


This article supplied by Troy Media.
Carney is promoting LNG as Canada’s future. Alberta insists the future still runs through oil
Prime Minister Mark Carney is a man in a hurry. He’s fast-tracking energy megaprojects to position Canada as a global LNG powerhouse, but Alberta’s oil ambitions and the private sector’s U.S. focus could throw his plan off course.
It’s all part of a broader federal strategy to reframe Canada’s energy priorities and show that his government is delivering economic results. Some say the motivation is political, with a fragile minority government and the potential for a snap election.
Others say it’s about legacy: Carney wants to be remembered as the prime minister who put Canada back on the global energy map.
That ambition came into sharper focus last week. On Thursday, he announced a second wave of projects being sent to the federal Major Projects Office, a body set up to fast-track infrastructure Ottawa sees as vital to national priorities.
The new list includes the Ksi Lisims liquefied natural gas project and the North Coast Transmission Line in British Columbia, along with a hydroelectric project in Nunavut. It also features nickel, graphite and tungsten mines in Ontario, Quebec and New Brunswick.
Ksi Lisims is the second LNG project Ottawa has submitted to the Major Projects Office.
Carney’s goal is clear, according to Lisa Baiton, president of the Canadian Association of Petroleum Producers. “With Ksi Lisims LNG and the related Prince Rupert Gas Transmission project joining LNG Canada Phase 2 on the major projects list, paired with Cedar and Woodfibre LNG, which are already under construction, Canada is on a path to become one of the top five LNG exporters in the world,” she said in a statement.
But not everyone is on the same page, especially Alberta.
The first batch of fast-tracked projects, announced two months ago, included a Montreal port expansion, a small modular nuclear plant in Ontario, mining projects in Saskatchewan and British Columbia, and LNG Canada Phase 2.
Alberta’s proposed oil export pipeline project was on neither list.
Premier Danielle Smith had said she hoped an agreement with Ottawa would be finalized by early last week to allow a new bitumen pipeline to proceed. That didn’t happen. But in a statement last Wednesday, her office said “sensitive” negotiations are continuing.
“Currently, we are working on a (memorandum of understanding) agreement with the federal government that includes the removal, carveout or overhaul of several damaging laws chasing away private investment in our energy sector, and an agreement to work towards ultimate approval of a bitumen pipeline to Asian markets,” the statement said.
Alberta argues such pipelines are critical if Canada is serious about energy diversification and global exports, particularly to Asia, where demand is rising. So far, those arguments don’t appear to have moved Carney.
With no federal deal in place, the industry is moving ahead with its own export agenda by doubling down on the U.S. market.
Enbridge has approved $1.4 billion in upgrades to its Mainline and Flanagan South pipelines, adding 250,000 barrels per day of capacity to move Canadian crude to the U.S. Midwest and Gulf Coast. The expansion is expected to come online in 2027.
The company also plans to test commercial demand in 2026 for a second phase of Mainline expansion that could add another 250,000 barrels per day.
Colin Gruending, Enbridge’s president of liquids pipelines, said the U.S. remains the most logical export market for Canadian oil, followed by Asia via the West Coast. The federal government’s goal of reducing reliance on U.S. buyers may take time.
Trans Mountain Corp., which moves oil sands crude to the Vancouver area for export, is reportedly also considering ways to increase volumes quickly and affordably.
Keystone XL, the pipeline project killed by former U.S. president Joe Biden in 2021, may also be back in play. The existing Keystone system, now owned by South Bow Corp., moves Canadian oil to U.S. Gulf Coast refineries. The cancelled XL expansion would have added new pipe and a more direct route south.
Whether Carney’s push makes Canada an LNG superpower or hits a wall of regional resistance and market reality, the energy and political maps are shifting.
Toronto-based Rashid Husain Syed is a highly regarded analyst specializing in energy and politics, particularly in the Middle East. In addition to his contributions to local and international newspapers, Rashid frequently lends his expertise as a speaker at global conferences. Organizations such as the Department of Energy in Washington and the International Energy Agency in Paris have sought his insights on global energy matters.
Troy Media empowers Canadian community news outlets by providing independent, insightful analysis and commentary. Our mission is to support local media in helping Canadians stay informed and engaged by delivering reliable content that strengthens community connections and deepens understanding across the country.
Indigenous
Top constitutional lawyer slams Indigenous land ruling as threat to Canadian property rights
From LifeSiteNews
One of Canada’s top constitutional legal experts blasted the push by federal, provincial, and municipal officials for all-encompassing Indigenous “reconciliation,” noting that the reality is all Canadians are and should be equal under the law and no one alive today is responsible for proven historical wrongdoings.
John Carpay, founder and president of the Justice Centre for Constitutional Freedoms (JCCF), noted in a recent commentary published in The Epoch Times that so-called reverse racism against non-Indigenous Canadians is still “racism.”
“Well-intentioned racism, to achieve the vague objective of ‘equity,’ is still racism,” Carpay noted.
“The only sure path to reconciliation, social harmony, and equal opportunity in Canada is the principle of equal rights for all, special privileges for none.”
Carpay noted that “the fact that aboriginal ethnic groups arrived in Canada earlier than other ethnic groups should be completely irrelevant when it comes to the application of the law.”
“Nobody disputes that different aboriginal tribes lived in this land before the arrival of Europeans, Africans, and Asians. The question is: Why should this fact matter?” he noted.
Carpay observed that when officials and courts apply the “law” differently to some “Canadians because of their race, ancestry, ethnicity, or descent,” the predictable and inevitable outcome “is strife, resentment, and fear.”
His comments came in light of a recent court ruling in British Columbia affecting property rights, Cowichan Tribes v. Canada (Attorney General), which saw the provincial Supreme Court rule that decades-long land grants by the government were not valid and violated a land title held by the tribes.
In essence, as noted by Carpay, the court “told the people (of various ethnicities) who live in some parts of Richmond, B.C., that the money they paid for their own properties does not guarantee them the right to own and enjoy their own homes.”
“The court ruled that the land titles system in B.C., which is built on the concept of indefeasible (indestructible) title, cannot be used or relied upon in the face of Cowichan claims. The Musqueam Indian Band and the Tsawwassen First Nation, claiming the same territory, also lost in court,” he stated.
Carpay noted that such a court ruling will only cause more division among Canadians and Indigenous peoples.
“Does anyone seriously believe that this Cowichan court ruling will bring reconciliation between Canadians of aboriginal ancestry and Canadians whose ancestry is Chinese, East Indian, Filipino, Nigerian, German, or English?” he observed.
“Of course not. The only results will be inter-ethnic fear, strife and conflict.”
He then observed what is a fact with land claims, noting, “Is there even one Canadian alive today about whom it could honestly be said that she or he stole land away from aboriginals?”
“Of course not. The court’s legal reasoning is based on inter-generational guilt, whereby people must pay for the sins (real or alleged) of their great-great-great-great-great-great-great-grandfathers. If one were to apply the court’s logic to today’s Germans and Japanese, these two ethnic groups would be forced to pay today for the atrocities that their ancestors committed during World War II,” he stated.
“Every continent features a long history of military, linguistic, cultural, and economic conquests as between different people groups. Would it be a good idea to apply the principle of inter-generational guilt to all of the world’s ethnic groups and countries? If not, then why try it now in Canada?”
Despite the concerns raised by Carpay, some federal politicians want to make it a crime to “deny” still unproven mass grave residential indigenous schools deaths claims.
Carpay warned that defining legal rights based on a person’s “membership in an oppressor’ group or a ‘victim’ group is Marxist.”
“Marxism repudiates the dignity and value of the individual, replacing it with a fixation on groups that are perpetually at war with each other,” he noted.
As reported by LifeSiteNews, new private members’ Bill C-254, An Act To Amend The Criminal Code introduced by New Democrat MP Leah Gazan, looks to give jail time to people who engage in so-called “Denialism.” The bill would look to jail those question the media and government narrative surrounding Canada’s “Indian Residential School system” that there are mass graves despite no evidence to support this claim.
In 2021 and 2022, the mainstream media ran with inflammatory and dubious claims that hundreds of children were buried and disregarded by Catholic priests and nuns who ran some Canadian residential schools. The reality is, after four years, there have been no mass graves discovered at residential schools.
However, as the claims went unfounded, since the spring of 2021, over 120 churches, most of them Catholic, many of them on indigenous lands that serve the local population, have been burned to the ground, vandalized, or defiled in Canada.
Last year, retired Manitoba judge Brian Giesbrecht said Canadians are being “deliberately deceived by their own government” after blasting the former Trudeau government for “actively pursuing” a policy that blames the Catholic Church for the unfounded “deaths and secret burials” of Indigenous children.

It should not take a crisis for Canada to develop the resources that make people and communities thrive.

AI Faces Energy Problem With Only One Solution, Oil and Gas
Federal budget: It’s not easy being green

‘Holy Sh*t!’: Podcaster Aghast As Charlie Kirk’s Security Leader Reads Texts He Allegedly Sent University Police
-
Daily Caller1 day ago
‘Holy Sh*t!’: Podcaster Aghast As Charlie Kirk’s Security Leader Reads Texts He Allegedly Sent University Police
-
 Alberta2 days ago
Alberta Offers Enormous Advantages for AI Data Centres
-
 Great Reset1 day ago
Canadian government forcing doctors to promote euthanasia to patients: report
-
 Carbon Tax22 hours ago
Carney fails to undo Trudeau’s devastating energy policies
-
 Alberta2 days ago
National Crisis Approaching Due To The Carney Government’s Centrally Planned Green Economy
-
 Alberta2 days ago
Calgary mayor should retain ‘blanket rezoning’ for sake of Calgarian families
-
 Health21 hours ago
NEW STUDY: Infant Vaccine “Intensity” Strongly Predicts Autism Rates Worldwide
-
 Alberta1 day ago
Sylvan Lake football coach fired for opposing transgender ideology elected to town council