Fraser Institute
Health-care costs for typical Canadian family will reach almost $18,000 this year
From the Fraser Institute
By Nathaniel Li and Milagros Palacios and Nadeem Esmail
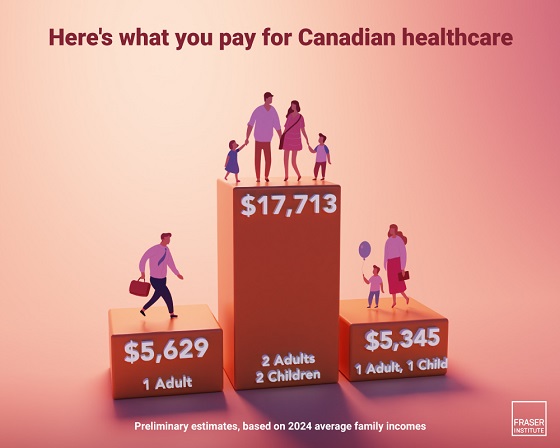
A typical Canadian family of four will pay an estimated $17,713 for public health-care insurance this year, finds a new study released today by the Fraser Institute, an independent, non-partisan Canadian public policy think-tank.
“Canadians pay a substantial amount of money for health care through a variety of taxes—even if we don’t pay directly for medical services,” said Nadeem Esmail, senior fellow at the Fraser Institute and co-author of The Price of Public Health Care Insurance, 2024.
Most Canadians are unaware of the true cost of health care because they never see a bill for medical services, may only be aware of partial costs collected via employer health taxes and contributions (in provinces that impose them), and because general government revenue—not a dedicated tax—funds Canada’s public health-care system.
The study estimates that a typical Canadian family consisting of two parents and two children with an average household income of $176,266 will pay $17,713 for public health care this year. Couples without dependent children will pay an estimated $16,528. Single Canadians will pay $5,629 for health care insurance, and single parents with one child will pay $5,345.
Since 1997, the first year for which data is available, the cost of healthcare for the average Canadian family has increased substantially, and has risen more quickly than its income. In fact, the cost of public health care insurance for the average Canadian family increased 2.2 times as fast as the cost of food, 1.6 times as fast as the cost of housing, and 1.7 times as fast as the average income.
“Understanding how much Canadians actually pay for health care, and how much that amount has increased over time, is an important first step for taxpayers to assess the value and performance of the health-care system, and whether it’s financially sustainable,” Esmail said.
- Canadians often misunderstand the true cost of our public health care system. This occurs partly because Canadians do not incur direct expenses for their use of health care, and partly because Canadians cannot readily determine the value of their contribution to public health care insurance.
- In 2024, preliminary estimates suggest the average payment for public health care insurance ranges from $4,908 to $17,713 for six common Canadian family types, depending on the type of family.
- Between 1997 and 2024, the cost of public health care insurance for the average Canadian family increased 2.2 times as fast as the cost of food, 1.7 times as fast as the average income, and 1.6 times as fast as the cost of shelter. It also increased much more rapidly than the cost of clothing, which has been falling in recent years.
- The 10 percent of Canadian families with the lowest incomes will pay an average of about $639 for public health care insurance in 2024. The 10 percent of Canadian families who earn an average income of $81,825 will pay an average of $7,758 for public health care insurance, and the families among the top 10 percent of income earners in Canada will pay $47,071.
Authors:


From the Fraser Institute
By Matthew Lau
It’s now more than four years since the federal Liberal government pledged $30 billion in spending over five years for $10-per-day national child care, and more than three years since Ontario’s Progressive Conservative government signed a $13.2 billion deal with the federal government to deliver this child-care plan.
Not surprisingly, with massive government funding came massive government control. While demand for child care has increased due to the government subsidies and lower out-of-pocket costs for parents, the plan significantly restricts how child-care centres operate (including what items participating centres may purchase), and crucially, caps the proportion of government funds available to private for-profit providers.
What have families and taxpayers got for this enormous government effort? Widespread child-care shortages across Ontario.
For example, according to the City of Ottawa, the number of children (aged 0 to 5 years) on child-care waitlists has ballooned by more than 300 per cent since 2019, there are significant disparities in affordable child-care access “with nearly half of neighbourhoods underserved, and limited access in suburban and rural areas,” and families face “significantly higher” costs for before-and-after-school care for school-age children.
In addition, Ottawa families find the system “complex and difficult to navigate” and “fewer child care options exist for children with special needs.” And while 42 per cent of surveyed parents need flexible child care (weekends, evenings, part-time care), only one per cent of child-care centres offer these flexible options. These are clearly not encouraging statistics, and show that a government-knows-best approach does not properly anticipate the diverse needs of diverse families.
Moreover, according to the Peel Region’s 2025 pre-budget submission to the federal government (essentially, a list of asks and recommendations), it “has maximized its for-profit allocation, leaving 1,460 for-profit spaces on a waitlist.” In other words, families can’t access $10-per-day child care—the central promise of the plan—because the government has capped the number of for-profit centres.
Similarly, according to Halton Region’s pre-budget submission to the provincial government, “no additional families can be supported with affordable child care” because, under current provincial rules, government funding can only be used to reduce child-care fees for families already in the program.
And according to a March 2025 Oxford County report, the municipality is experiencing a shortage of child-care staff and access challenges for low-income families and children with special needs. The report includes a grim bureaucratic predication that “provincial expansion targets do not reflect anticipated child care demand.”
Child-care access is also a problem provincewide. In Stratford, which has a population of roughly 33,000, the municipal government reports that more than 1,000 children are on a child-care waitlist. Similarly in Port Colborne (population 20,000), the city’s chief administrative officer told city council in April 2025 there were almost 500 children on daycare waitlists at the beginning of the school term. As of the end of last year, Guelph and Wellington County reportedly had a total of 2,569 full-day child-care spaces for children up to age four, versus a waitlist of 4,559 children—in other words, nearly two times as many children on a waitlist compared to the number of child-care spaces.
More examples. In Prince Edward County, population around 26,000, there are more than 400 children waitlisted for licensed daycare. In Kawartha Lakes and Haliburton County, the child-care waitlist is about 1,500 children long and the average wait time is four years. And in St. Mary’s, there are more than 600 children waitlisted for child care, but in recent years town staff have only been able to move 25 to 30 children off the wait list annually.
The numbers speak for themselves. Massive government spending and control over child care has created havoc for Ontario families and made child-care access worse. This cannot be a surprise. Quebec’s child-care system has been largely government controlled for decades, with poor results. Why would Ontario be any different? And how long will Premier Ford allow this debacle to continue before he asks the new prime minister to rethink the child-care policy of his predecessor?

Matthew Lau
Adjunct Scholar, Fraser Institute
From the Fraser Institute
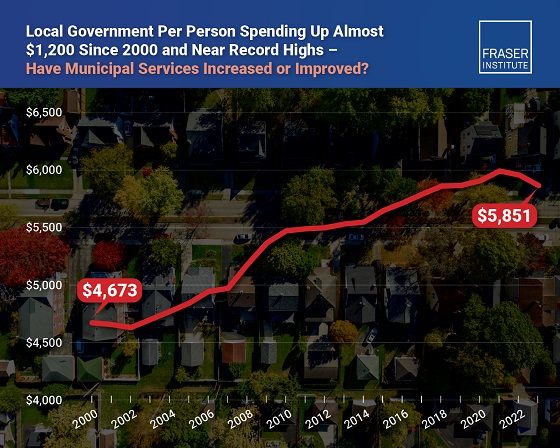
Municipal government spending in Canada hit near record levels in recent years, finds a new study by the Fraser Institute, an independent, non-partisan Canadian public policy think-tank.
“In light of record-high spending in municipalities across Canada, residents should consider whether or not crime, homelessness, public transit and other services have actually improved,” said Austin Thompson, senior policy analyst at the Fraser Institute and author of The Expanding Finances of Local Governments in Canada.
From 2000 to 2023, per-person spending (inflation-adjusted) increased by 25.2 per cent, reaching a record-high $5,974 per person in 2021 before declining slightly to $5,851 in 2023, the latest year of available data.
During that same period, municipal government revenue—generated from property taxes and transfers from other levels of government—increased by 33.7 per cent per person (inflation-adjusted).
And yet, among all three levels of government including federal and provincial, municipal government spending (adjusted for inflation) has actually experienced the slowest rate of growth over the last 10 years, underscoring the large spikes in spending at all government levels across Canada.
“Despite claims from municipal policymakers about their dire financial positions, Canadians should understand the true state of finances at city hall so they can decide whether they’re getting good value for their money,” said Jake Fuss, director of fiscal studies at the Fraser Institute.
The Expanding Finances of Local Governments in Canada, 1990–2023
- Canada’s local governments have experienced substantial fiscal growth in recent decades.
- Revenue and expenditure by local governments—including municipal governments, school boards, and Indigenous governments—have increased faster than population growth and inflation combined. From 1990 to 2023, real per-capita revenue rose by 32.7%, and expenditure by 30.0%.
- Local governments represent a significant component of Canada’s broader public sector. In 2023, net of inter-governmental transfers, municipal governments and school boards accounted for 18.6% of total government expenditure and 11.1% of revenue.
- Despite this growth, local governments’ share of overall government revenue and expenditure has declined over time—especially since the COVID-19 pandemic—as federal and provincial budgets have expanded even more rapidly.
- Nevertheless, between 2008 and 2023 the inflation-adjusted per-capita revenue of municipal governments in-creased by 10.1% and their expenditure by 12.4% , on average across the provinces.
- Over the same period, municipal governments recorded above-inflation increases in their combined annual operating surpluses, which contributed to an 88.1% inflation-adjusted rise in their net worth—raising important questions about the allocation of accumulated resources.
- In 2023, Ontario recorded the highest per-capita municipal revenue among the provinces ($4,156), while Alberta had the highest per-capita expenditure ($3,750). Prince Edward Island reported the lowest per-capita municipal revenue ($1,635) and expenditure ($1,186).
- Wide variation in per-capita municipal revenue and expenditure across the provinces reflects differences in the responsibilities provinces assign to municipalities, as well as possible disparities in the efficiency of service delivery—issues that warrant further scrutiny.
Click Here To Read The Full Study


The Quiet Invasion: How Transnational Crime and Chinese State Actors Infiltrated Vancouver and Eroded Canada’s Sovereignty

Boxing authority says allegedly male competitor should return Olympic medal won against women

Canada’s euthanasia regime is not health care, but a death machine for the unwanted

Alberta’s government is investing $5 million to help launch the world’s first direct air capture centre at Innisfail
-
 Alberta7 hours ago
Alberta Independence Seekers Take First Step: Citizen Initiative Application Approved, Notice of Initiative Petition Issued
-
 Automotive1 day ago
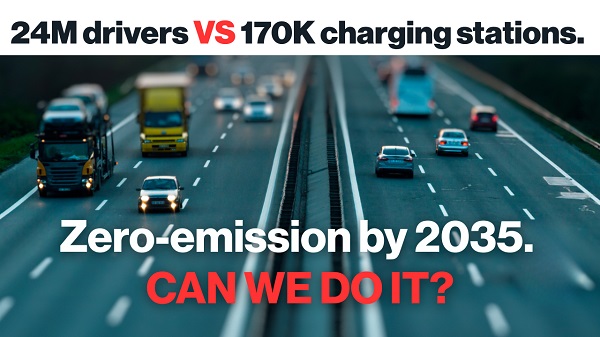
Electric vehicle sales are falling hard in BC, and it is time to recognize reality.
-
 Automotive1 day ago
Power Struggle: Electric vehicles and reality
-
 Business9 hours ago
Canada Caves: Carney ditches digital services tax after criticism from Trump
-
 Crime9 hours ago
Suspected ambush leaves two firefighters dead in Idaho
-
 Business1 day ago
Trump on Canada tariff deadline: ‘We can do whatever we want’
-
 Brownstone Institute2 days ago
FDA Exposed: Hundreds of Drugs Approved without Proof They Work
-
 Alberta7 hours ago
Why the West’s separatists could be just as big a threat as Quebec’s