Fraser Institute
Health-care costs for typical Canadian family will reach almost $18,000 this year
From the Fraser Institute
By Nathaniel Li and Milagros Palacios and Nadeem Esmail
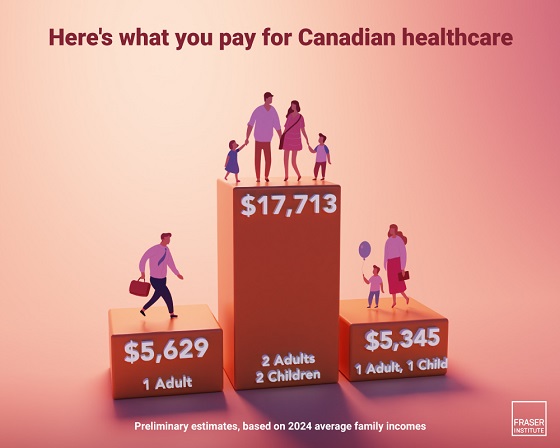
A typical Canadian family of four will pay an estimated $17,713 for public health-care insurance this year, finds a new study released today by the Fraser Institute, an independent, non-partisan Canadian public policy think-tank.
“Canadians pay a substantial amount of money for health care through a variety of taxes—even if we don’t pay directly for medical services,” said Nadeem Esmail, senior fellow at the Fraser Institute and co-author of The Price of Public Health Care Insurance, 2024.
Most Canadians are unaware of the true cost of health care because they never see a bill for medical services, may only be aware of partial costs collected via employer health taxes and contributions (in provinces that impose them), and because general government revenue—not a dedicated tax—funds Canada’s public health-care system.
The study estimates that a typical Canadian family consisting of two parents and two children with an average household income of $176,266 will pay $17,713 for public health care this year. Couples without dependent children will pay an estimated $16,528. Single Canadians will pay $5,629 for health care insurance, and single parents with one child will pay $5,345.
Since 1997, the first year for which data is available, the cost of healthcare for the average Canadian family has increased substantially, and has risen more quickly than its income. In fact, the cost of public health care insurance for the average Canadian family increased 2.2 times as fast as the cost of food, 1.6 times as fast as the cost of housing, and 1.7 times as fast as the average income.
“Understanding how much Canadians actually pay for health care, and how much that amount has increased over time, is an important first step for taxpayers to assess the value and performance of the health-care system, and whether it’s financially sustainable,” Esmail said.
- Canadians often misunderstand the true cost of our public health care system. This occurs partly because Canadians do not incur direct expenses for their use of health care, and partly because Canadians cannot readily determine the value of their contribution to public health care insurance.
- In 2024, preliminary estimates suggest the average payment for public health care insurance ranges from $4,908 to $17,713 for six common Canadian family types, depending on the type of family.
- Between 1997 and 2024, the cost of public health care insurance for the average Canadian family increased 2.2 times as fast as the cost of food, 1.7 times as fast as the average income, and 1.6 times as fast as the cost of shelter. It also increased much more rapidly than the cost of clothing, which has been falling in recent years.
- The 10 percent of Canadian families with the lowest incomes will pay an average of about $639 for public health care insurance in 2024. The 10 percent of Canadian families who earn an average income of $81,825 will pay an average of $7,758 for public health care insurance, and the families among the top 10 percent of income earners in Canada will pay $47,071.
Authors:


From the Fraser Institute
Do economic rivalries between Texas and California or New York and Florida feel like yet another sign that America has become hopelessly divided? There’s a bright side to their disagreements, and a new ranking of economic freedom across the states helps explain why.
As a popular bumper sticker among economists proclaims: “I heart federalism (for the natural experiments).” In a federal system, states have wide latitude to set priorities and to choose their own strategies to achieve them. It’s messy, but informative.
New York and California, along with other states like New Mexico, have long pursued a government-centric approach to economic policy. They tax a lot. They spend a lot. Their governments employ a large fraction of the workforce and set a high minimum wage.
They aren’t socialist by any means; most property is still in private hands. Consumers, workers and businesses still make most of their own decisions. But these states control more resources than other states do through taxes and regulation, so their governments play a larger role in economic life.
At the other end of the spectrum, New Hampshire, Tennessee, Florida and South Dakota allow citizens to make more of their own economic choices, keep more of their own money, and set more of their own terms of trade and work.
They aren’t free-market utopias; they impose plenty of regulatory burdens. But they are economically freer than other states.
These two groups have, in other words, been experimenting with different approaches to economic policy. Does one approach lead to higher incomes or faster growth? Greater economic equality or more upward mobility? What about other aspects of a good society like tolerance, generosity, or life satisfaction?
For two decades now, we’ve had a handy tool to assess these questions: The Fraser Institute’s annual “Economic Freedom of North America” index uses 10 variables in three broad areas—government spending, taxation, and labor regulation—to assess the degree of economic freedom in each of the 50 states and the territory of Puerto Rico, as well as in Canadian provinces and Mexican states.
It’s an objective measurement that allows economists to take stock of federalism’s natural experiments. Independent scholars have done just that, having now conducted over 250 studies using the index. With careful statistical analyses that control for the important differences among states—possibly confounding factors such as geography, climate, and historical development—the vast majority of these studies associate greater economic freedom with greater prosperity.
In fact, freedom’s payoffs are astounding.
States with high and increasing levels of economic freedom tend to see higher incomes, more entrepreneurial activity and more net in-migration. Their people tend to experience greater income mobility, and more income growth at both the top and bottom of the income distribution. They have less poverty, less homelessness and lower levels of food insecurity. People there even seem to be more philanthropic, more tolerant and more satisfied with their lives.
New Hampshire, Tennessee, and South Dakota topped the latest edition of the report while Puerto Rico, New Mexico, and New York rounded out the bottom. New Mexico displaced New York as the least economically free state in the union for the first time in 20 years, but it had always been near the bottom.
The bigger stories are the major movers. The last 10 years’ worth of available data show South Carolina, Ohio, Wisconsin, Idaho, Iowa and Utah moving up at least 10 places. Arizona, Virginia, Nebraska, and Maryland have all slid down 10 spots.
Over that same decade, those states that were among the freest 25 per cent on average saw their populations grow nearly 18 times faster than those in the bottom 25 per cent. Statewide personal income grew nine times as fast.
Economic freedom isn’t a panacea. Nor is it the only thing that matters. Geography, culture, and even luck can influence a state’s prosperity. But while policymakers can’t move mountains or rewrite cultures, they can look at the data, heed the lessons of our federalist experiment, and permit their citizens more economic freedom.

From the Fraser Institute
By Matthew Lau
Canada’s lagging productivity growth has been widely discussed, especially after Bank of Canada senior deputy governor Carolyn Rogers last year declared it “an emergency” and said “it’s time to break the glass.” The federal Liberal government, now entering its eleventh year in office, admitted in its recent budget that “productivity remains weak, limiting wage gains for workers.”
Numerous recent reports show just how weak Canada’s productivity has been. A recent study published by the Fraser Institute shows that since 2001, labour productivity has increased only 16.5 per cent in Canada vs. 54.7 per cent in the United States, with our underperformance especially notable after 2017. Weak business investment is a primary reason for Canada’s continued poor economic outcomes.
A recent McKinsey study provides worrying details about how the productivity crisis pervades almost all sectors of the economy. Relative to the U.S., our labour productivity underperforms in: mining, quarrying, and oil and gas extraction; construction; manufacturing; transportation and warehousing; retail trade; professional, scientific, and technical services; real estate and rental leasing; wholesale trade; finance and insurance; information and cultural industries; accommodation and food services; utilities; arts, entertainment and recreation; and administrative and support, waste management and remediation services.
Canada has relatively higher labour productivity in just one area: agriculture, forestry, fishing and hunting. To make matters worse, in most areas where Canada’s labour productivity is less than American, McKinsey found we had fallen further behind from 2014 to 2023. In addition to doing poorly, Canada is trending in the wrong direction.
Broadening the comparison to include other OECD countries does not make the picture any rosier—Canada “is growing more slowly and from a lower base,” as McKinsey put it. This underperformance relative to other countries shows Canada’s economic productivity crisis is not the result of external factors but homemade.
The federal Liberals have done little to reverse our relative decline. The Carney government’s proposed increased spending on artificial intelligence (AI) may or may not help. But its first budget missed a clear opportunity to implement tax reform and cuts. As analyses from the Fraser Institute, University of Calgary, C.D. Howe Institute, TD Economics and others have argued, fixing Canada’s uncompetitive tax regime would help lift productivity.
Regulatory expansion has also driven Canada’s relative economic decline but the federal budget did not reduce the red tape burden. Instead, the Carney government empowered cabinet to decide which large natural resource and infrastructure projects are in the “national interest”—meaning that instead of predictable transparent rules, businesses must answer to the whims of politicians.
The government has also left in place many of its Trudeau-era environmental regulations, which have helped push pipeline investors away for years. It is encouraging that a new “memorandum of understanding” between Ottawa and Alberta may pave the way for a new oil pipeline. A memorandum of undertaking would have been better.
Although the government paused its phased-in ban on conventionally-powered vehicle sales in the face of heavy tariff-related headwinds to Canada’s automobile sector, it still insists that all new light-duty vehicle sales by 2035 must be electric. Liberal MPs on the House of Commons Industry Committee recently voted against a Conservative motion calling for repeal of the EV mandate. Meanwhile, Canadian consumers are voting with their wallets. In September, only 10.2 per cent of new motor vehicle sales were “zero-emission,” an ominous18.2 per cent decline from last year.
If the Carney government continues down its current path, it will only make productivity and consumer welfare worse. It should change course to reverse Canada’s economic underperformance and help give living standards a much-needed boost.


Wisdom of Our Elders: The Contempt for Memory in Canadian Indigenous Policy

Liberal bill “targets Christians” by removing religious exemption in hate-speech law

Egypt, Iran ‘completely reject’ World Cup ‘Pride Match’ plan

Canada’s free speech record is cracking under pressure
-
 Energy1 day ago
Canada’s future prosperity runs through the northwest coast
-
 Fly Straight - John Ivison2 days ago
MPs who cross the floor are dishonourable members
-
 Business2 days ago
The world is no longer buying a transition to “something else” without defining what that is
-
 illegal immigration2 days ago
EXCLUSIVE: Canadian groups, First Nation police support stronger border security
-
Business2 days ago
Brutal economic numbers need more course corrections from Ottawa
-
Business11 hours ago
Fuelled by federalism—America’s economically freest states come out on top
-
 International19 hours ago
Tyler Robinson shows no remorse in first court appearance for Kirk assassination
-
 illegal immigration19 hours ago
US Notes 2.5 million illegals out and counting