Fraser Institute
Canadians are ready for health-care reform—Australia shows the way

From the Fraser Institute
By Bacchus Barua and Mackenzie Moir
Australia offers real-world examples of how public/private partnerships can be successfully integrated in a universal health-care framework. Not only does Australia prove it can be done without sacrificing universal coverage for all, Australia spends less money (as a share of its economy) than Canada and enjoys more timely medical care.
Canada’s health-care system is crumbling. Long wait times, hallway health care and burned-out staff are now the norm. Unsurprisingly, a new poll finds that the majority of Canadians (73 per cent) say the system needs major reform.
As noted in a recent editorial in the Globe and Mail, we can learn key lessons from Australia.
There are significant similarities between the two countries with respect to culture, the economy and even geographic characteristics. Both countries also share the goal of ensuring universal health coverage. However, Australia outperforms Canada on several key health-care performance metrics.
After controlling for differences in age (where appropriate) between the two countries, our recent study found that Australia’s health-care system outperformed Canada’s on 33 (of 36) performance measures. For example, Australia had more physicians, hospital beds, CT scanners and MRI machines per person compared to Canada. And among the 30 universal health-care countries studied, Canada ranked in the bottom quartile for the availability of these critical health-care resources.
Australia also outperforms Canada on key measures of wait times. In 2023 (the latest year of available data), 39.5 per cent of patients in Australia were able to make a same or next day appointment when they were sick compared to only 22.3 per cent in Canada. And 9.6 per cent of Canadians reported waiting more than one year to see a specialist compared to only 4.5 per cent of Australians. Similarly, almost one-in-five (19.9 per cent) Canadians reported waiting more than one year for non-emergency surgery compared to only 11.8 per cent of Australians.
So, what does Australia do differently to outperform Canada on these key measures?
Although the Globe and Mail editorial touches on the availability of private insurance in Australia, less attention is given to the private sector’s prominent role in the delivery of health care.
In 2016 (the latest year of available data) almost half of all hospitals in Australia (48.5 per cent) were private. And in 2021/22 (again, the latest year of available data), 41 per cent of all hospital care took place in a private facility. That percentage goes up to 70.3 per cent when only considering hospital admissions for non-emergency surgery.
But it’s not only higher-income patients who can afford private insurance (or those paying out of pocket) who get these surgeries. The Australian government encourages the uptake of private insurance and partially subsidizes private care (at a rate of 75 per cent of the public fee), and governments in Australia also regularly contract out publicly-funded care to private facilities.
In 2021/22, more than 300,000 episodes of publicly-funded care occurred in private facilities in Australia. Private hospitals also delivered 73.5 per cent of care funded by Australia’s Department of Veterans’ Affairs. And in 2019/20, government sources (including the federal government) paid for almost one-third (32.8 per cent) of private hospital expenditures.
Which takes us back to the new opinion poll (by Navigator), which found that 69 per cent of Canadians agree that health-care services should include private-sector involvement. While defenders of the status quo continue to criticize this approach, Australia offers real-world examples of how public/private partnerships can be successfully integrated in a universal health-care framework. Not only does Australia prove it can be done without sacrificing universal coverage for all, Australia spends less money (as a share of its economy) than Canada and enjoys more timely medical care.
While provincial governments remain stubbornly committed to a failed model, Canadians are clearly expressing their desire for health-care reforms that include a prominent role for private partners in the delivery of universal care.
Australia is just one example. Public/private partnerships are the norm in several more successful universal health-care systems (such as Germany and Switzerland). Instead of continuing to remain an outlier, Canada should follow the examples of Australia and other countries and engage with the private sector to fulfill the promise of universal health care.
Authors:

From the Fraser Institute
By Matthew Lau
At the beginning of June, the Canadian Dental Care Plan expanded to include all eligible adults. To be eligible, you must: not have access to dental insurance, have filed your 2024 tax return in Canada, have an adjusted family net income under $90,000, and be a Canadian resident for tax purposes.
As a result, millions more Canadians will be able to access certain dental services at reduced—or no—out-of-pocket costs, as government shoves the costs onto the backs of taxpayers. The first half of the proposition, accessing services at reduced or no out-of-pocket costs, is always popular; the second half, paying higher taxes, is less so.
A Leger poll conducted in 2022 found 72 per cent of Canadians supported a national dental program for Canadians with family incomes up to $90,000—but when asked whether they would support the program if it’s paid for by an increase in the sales tax, support fell to 42 per cent. The taxpayer burden is considerable; when first announced two years ago, the estimated price tag was $13 billion over five years, and then $4.4 billion ongoing.
Already, there are signs the final cost to taxpayers will far exceed these estimates. Dr. Maneesh Jain, the immediate past-president of the Ontario Dental Association, has pointed out that according to Health Canada the average patient saved more than $850 in out-of-pocket costs in the program’s first year. However, the Trudeau government’s initial projections in the 2023 federal budget amounted to $280 per eligible Canadian per year.
Not all eligible Canadians will necessarily access dental services every year, but the massive gap between $850 and $280 suggests the initial price tag may well have understated taxpayer costs—a habit of the federal government, which over the past decade has routinely spent above its initial projections and consistently revises its spending estimates higher with each fiscal update.
To make matters worse there are also significant administrative costs. According to a story in Canadian Affairs, “Dental associations across Canada are flagging concerns with the plan’s structure and sustainability. They say the Canadian Dental Care Plan imposes significant administrative burdens on dentists, and that the majority of eligible patients are being denied care for complex dental treatments.”
Determining eligibility and coverage is a huge burden. Canadians must first apply through the government portal, then wait weeks for Sun Life (the insurer selected by the federal government) to confirm their eligibility and coverage. Unless dentists refuse to provide treatment until they have that confirmation, they or their staff must sometimes chase down patients after the fact for any co-pay or fees not covered.
Moreover, family income determines coverage eligibility, but even if patients are enrolled in the government program, dentists may not be able to access this information quickly. This leaves dentists in what Dr. Hans Herchen, president of the Alberta Dental Association, describes as the “very awkward spot” of having to verify their patients’ family income.
Dentists must also try to explain the program, which features high rejection rates, to patients. According to Dr. Anita Gartner, president of the British Columbia Dental Association, more than half of applications for complex treatment are rejected without explanation. This reduces trust in the government program.
Finally, the program creates “moral hazard” where people are encouraged to take riskier behaviour because they do not bear the full costs. For example, while we can significantly curtail tooth decay by diligent toothbrushing and flossing, people might be encouraged to neglect these activities if their dental services are paid by taxpayers instead of out-of-pocket. It’s a principle of basic economics that socializing costs will encourage people to incur higher costs than is really appropriate (see Canada’s health-care system).
At a projected ongoing cost of $4.4 billion to taxpayers, the newly expanded national dental program is already not cheap. Alas, not only may the true taxpayer cost be much higher than this initial projection, but like many other government initiatives, the dental program already seems to be more costly than initially advertised.

Matthew Lau
Adjunct Scholar, Fraser Institute
Business
Prairie provinces and Newfoundland and Labrador see largest increases in size of government

From the Fraser Institute
By Jake Fuss and Grady Munro
A recent study found that Canada has experienced one of the largest increases in the size of government of any advanced country over the last decade. But within Canada, which provinces have led the way?
The size of government refers to the extent to which resources within the economy are controlled and directed by the government, and has important implications for economic growth, living standards, and economic freedom—the degree to which people are allowed to make their own economic choices.
Too much of anything can be harmful, and this is certainly true regarding the size of government. When government grows too large it begins to take on roles and resources that are better left to the private sector. For example, rather than focusing on core functions like maintaining the rule of law or national defence, a government that has grown too large might begin subsidizing certain businesses and industries over others (i.e. corporate welfare) in order to pick winners and losers in the market. As a result, economic growth slows and living standards are lower than they otherwise would be.
One way to measure the size of government is by calculating total general government spending as a share of the economy (GDP). General government spending refers to spending by governments at all levels (federal, provincial, and municipal), and by measuring this as a share of gross domestic product (GDP) we can compare across jurisdictions of different sizes.
A recent study compared the size of government in Canada as a whole with that of 39 other advanced economies worldwide, and found that Canada experienced the second-largest increase in the size of government (as a share of the economy) from 2014 to 2024. In other words, since 2014, governments in Canada have expanded their role within the economy faster than governments in virtually every other advanced country worldwide—including all other countries within the Group of Seven (France, Germany, Italy, Japan, the United Kingdom, and the United States). Moreover, the study showed that Canada as a whole has exceeded the optimal size of government (estimated to fall between 24 and 32 per cent of GDP) at which a country can maximize their economic growth. Beyond that point, growth slows and is lower than it otherwise would be.
However, Canada is a decentralized country and provinces vary as to the extent to which governments direct overall economic activity. Using data from Statistics Canada, the following charts illustrate which provinces in Canada have the largest size of government and which have seen the largest increases since 2014.

The chart above shows total general government spending as a share of GDP for all ten provinces in 2023 (the latest year of available provincial data). The size of government in the provinces varies considerably, ranging from a high of 61.4 per cent in Nova Scotia to a low of 30.0 per cent in Alberta. There are geographical differences, as three Atlantic provinces (Nova Scotia, Prince Edward Island, and New Brunswick) have the largest governments while the three western-most provinces (Alberta, Saskatchewan, and British Columbia) have the smallest governments. However, as of 2023, all provinces except Alberta exceeded the optimal size of government—which again, is between 24 and 32 per cent of the economy.

To show which provinces have experienced the greatest increase in the size of government in recent years, the second chart shows the percentage point increase in total general government spending as a share of GDP from 2014 to 2023. It should be noted that this is measuring the expansion of the federal government’s role in the economy—which has been substantial nationwide—as well as growth in the respective provincial and municipal governments.
The increases in the size of government since 2014 are largest in four provinces: Newfoundland and Labrador (10.82 percentage points), Alberta (7.94 percentage points), Saskatchewan (7.31 percentage points), and Manitoba (7.17 percentage points). These are all dramatic increases—for perspective, in the study referenced above, Estonia’s 6.66 percentage point increase in its size of government was the largest out of 40 advanced countries.
The remaining six provinces experienced far lower increases in the size of government, ranging from a 2.74 percentage point increase in B.C. to a 0.44 percentage point increase in Quebec. However, since 2014, every province in Canada has seen government expand its role within the economy.
Over the last decade, Canada has experienced a substantial increase in the size of total government. Within the country, Newfoundland and Labrador and the three Prairie provinces have led the way in growing their respective governments.

RFK Jr. says Hep B vaccine is linked to 1,135% higher autism rate

Blind to the Left: Canada’s Counter-Extremism Failure Leaves Neo-Marxist and Islamist Threats Unchecked
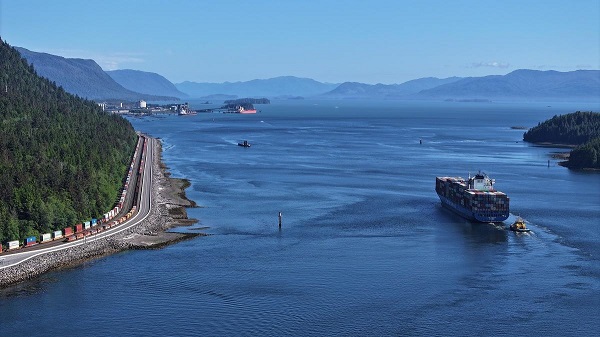
Why it’s time to repeal the oil tanker ban on B.C.’s north coast

Alberta Provincial Police – New chief of Independent Agency Police Service
-
 Agriculture2 days ago
Canada’s supply management system is failing consumers
-
 Alberta1 day ago
Alberta uncorks new rules for liquor and cannabis
-
 Energy21 hours ago
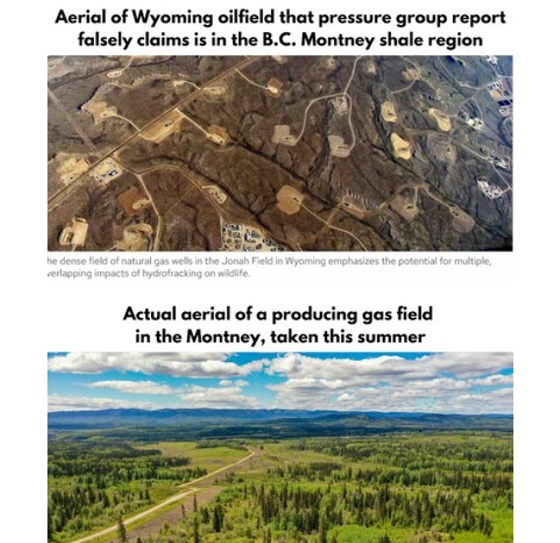
B.C. Residents File Competition Bureau Complaint Against David Suzuki Foundation for Use of False Imagery in Anti-Energy Campaigns
-
 COVID-1920 hours ago
Court compels RCMP and TD Bank to hand over records related to freezing of peaceful protestor’s bank accounts
-
 Crime2 days ago
Project Sleeping Giant: Inside the Chinese Mercantile Machine Linking Beijing’s Underground Banks and the Sinaloa Cartel
-
 International1 day ago
Trump transportation secretary tells governors to remove ‘rainbow crosswalks’
-
 Alberta1 day ago
Alberta Next: Alberta Pension Plan
-
 C2C Journal18 hours ago
Canada Desperately Needs a Baby Bump