Energy
444,000 semi-loads of food? Just another day on planet Earth
From the Frontier Centre for Public Policy
By Terry Etam
At 100 million b/d, the world consumes a billion barrels of oil every ten days. Eleven billion barrels of recoverable reserves will meet the world’s needs for about 110 days, or just under four months. And global demand continues to grow.
The scope of this discussion goes far beyond oil demand. It is imperative that people understand energy demand, and particularly so on a global scale.
A friend of mine, always with a keen eye on interesting things, passed on an interesting quote from the CERA Week energy conference the other week. The head of the International Energy Forum mentioned a surprising statistic, as quoted by Javier Blas on Twitter: “Heathrow airport in London uses more energy than the whole African nation of Sierra Leone [population ~8.5 million].” Yikes!
Here’s another one that turned up randomly in the feed by a credible source: “If we keep growing our energy usage (2.9% CAGR last 350 years) we will use more energy in the next 25 years than in all prior human history. 3x in 39 years and 9x by the end of the century.”
Energy is an amazing topic, both sources and uses. The sheer scale of what we require for our present lifestyle is mind-blowing when placed in concrete contexts like above. In the abstract, the numbers don’t mean anything. The world consumes over 100 million barrels of oil per day. So what? Is that a lot? Sure it’s a big number but so is 8 billion people. Either stat is hard to wrap one’s head around.
Consider the following with respect to oil consumption/production: ExxonMobil made waves recently for a large oil discovery offshore Guyana, in an era when there aren’t that many discoveries being made (the flip side of the demand for oil/gas companies to return money to shareholders means exploration generally takes a back seat). Reuters picked up the story: ExxonMobil announced a new discovery, one of 30 since 2015, in a 6.6 million acre area that to date has been found to hold 11 billion barrels of recoverable oil, which also equals the country’s total. The results are significant, moving Guyana up to 17th on the world’s petroleum reserve rankings, similar to Norway, Brazil, or Algeria.
Now compare that number to consumption. At 100 million b/d, the world consumes a billion barrels of oil every ten days. Eleven billion barrels of recoverable reserves will meet the world’s needs for about 110 days, or just under four months. And global demand continues to grow.
The scope of this discussion goes far beyond oil demand. It is imperative that people understand energy demand, and particularly so on a global scale.
Look at this history of global energy consumption chart from Our World in Data:

It’s nuts. But it coincides very well with the rising standard of living attained by humanity, particularly in the west, an increase the rest of the world wants to emulate.
Consider the following statistics if you think that trajectory is going to slow down or reverse any time soon.
Africa has about 1.2 billion people, or roughly 15 percent of the earth’s population. Yet Africa accounts for 2 percent of global air traffic. By contrast, Europe has a population of about 740 million, and accounts for 31 percent of global air traffic.
What if Africans decide they want to live like Europeans, air-travel-wise, which is not just justified on moral grounds but actually more functionally logical, because Europe covers only 1/3 of Africa’s size of 30 million square kilometres?
What if the rest of the world wants to enjoy air conditioning to the extent the US does (and why on earth wouldn’t they)? According to the US Energy Information Agency, nearly 90 percent of US households use air conditioning, and virtually every office building does as well. The US has about 130 million households for 330 million people, or about 2.5 people per household. If Africa had a similar ratio, they would have 480,000,000 households, and if a similar proportion had AC there would be 430,000,000 households with AC. It’s safe to say that today in Africa the number of households with AC is far closer to zero than 90 percent. (Even communists/hardcore socialists support near-universal air conditioning, though they call it a ‘right’ by way of that fuzzy but firm ‘gimme that’ appropriation way of theirs.)
Now add in India, with another 1.4 billion people, and do the same math. A billion air conditioners worth of global demand is not a ridiculous estimate, not when considering Pakistan, Bangladesh, Indonesia, parts of South America… in addition to Africa, India…
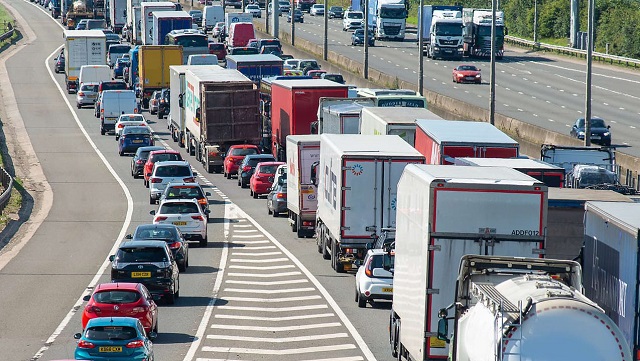
Consider even food, and the logistical magnum opus required to keep countries food-riot-free. A typical western website says that the average person consumes 3-4 pounds of food per day. Let’s say the rest of the world isn’t so lucky, and we’ll call it 2.5 pounds per day for a global average (each new cruise ship drags the world average up considerably). There are 8 billion of us schlepping around planet earth. A semi trailer can carry about 45,000 pounds of cargo. So every day, the equivalent of about 444,000 semis full of food are forklifted out of trucks and down the gullets of 8 billion upturned mouths. Every freaking day, without a break.
And that’s just food. What about IKEA. And Costco. And Home Depot. And Walmart. And all the other stuff in our world.
And billions more people are striving to fill up the SUV (yes, everywhere you go, SUV) at their local Costco/Home Depot/Walmart, as soon as one arrives in their community.
Ah hell, I give up. The scale of all this stuff is unfathomable. And yet it all gets where it needs to go, every day, as long as there’s energy.
Any singular household staple must be there, in abundance, or all hell breaks loose. Remember Covid > toilet paper? What happens as soon as there is even a rumour of a shortage? Social deviants, which are harder to eradicate than (and just as useful as) STDs, get into gear and begin hoarding in order to resell at a profit. It just happens, one of the unfortunate costs of living in a free society. (I’m not suggesting that those people should be found and beaten with a tire iron, but then again I’m not suggesting that they shouldn’t.)
When we think of energy consumption, we tend to think of our hilariously comfortable lives in western nations, where supermarkets are perpetually full, where gasoline and heating fuels are available 24/7/365 at reasonable prices, where flying wherever and whenever we want, with minimal hassle, is one step away from being viewed as a human right. We are correct in that our energy consumption per capita in the west is very high. But on an outright total consumption basis, individual country statistics are pretty wild. And saddening, in some ways.
First the wild part: You would expect (or I did anyway) the US to be either at the top of the consumption pile or close; it is and has been an economic juggernaut for a century. But not even close: in 2022, the US consumed about 96 exajoules of energy, which is a lot – that number equals the consumption of India, Russia, Japan and Canada combined. But way out in front is China, with 2022 consumption of 159 exajoules. No one should be surprised China leads the world in renewables installation and coal fired power plant construction. They need it all.
Where it gets sad is to wander further down the list to the lowest consumers. The site linked above shows a graphic of the world, with each country colour-coded for total energy consumption. The lowest on the colour scale is a pale yellow representing 20 exajoules per year. The scale rises up through blues and towards a dark navy which represents China at the top of the heap.
Most African countries, and some South American ones, do not even warrant a definition in the legend at all, and are simply greyed out. They have so little energy consumption they hardly even make it onto the raw data table. Hundreds of millions of people live like that. But only as long as they have to.
It is very sobering to see how much of the world lives, and how very far they are from the West’s standard of living. The West’s leaders push the concept of ‘electrify everything’, a concept that only makes sense if one is looking no further than their backyard and has zero feel for the true global situation. In much of the world, they would just as happily get behind the slogan ‘electrify anything’.
It is hard to imagine this energy consumption trajectory falling; we’d be very lucky if it stayed flat. But that seems like an unrealistic hope. The developing world clearly has every incentive and right to advance towards the West’s standard of living, and if they get close global energy consumption will head off further into the stratosphere. Here in the West, we play cute little games like a forced switch to EVs, while ignoring almost totally any common sense commentary on the subject (For example, Toyota’s 1:6:90 rule which states that for the same amount of raw materials to manufacture one EV, Toyota can make six plug-in hybrids or 90 hybrids, and in doing so would achieve 37 times the emissions reduction of a single EV. Yet Toyota is scorned for such logic on the grounds that “Toyota’s reluctance to fully embrace EVs can hinder innovation in the EV industry.” Note that there is no challenge to the facts themselves, just a bruising of the ego of the think tanks.)
Anyone that provides energy of any kind should roll up their sleeves, there’s a lot of work to be done, and those who wish to hunt for energy villains will get run over, in due course.
Terry Etam is a columnist with the BOE Report, a leading energy industry newsletter based in Calgary. He is the author of The End of Fossil Fuel Insanity. You can watch his Policy on the Frontier session from May 5, 2022 here.
Alberta
COWBOY UP! Pierre Poilievre Promises to Fight for Oil and Gas, a Stronger Military and the Interests of Western Canada

Fr0m Energy Now
As Calgarians take a break from the incessant news of tariff threat deadlines and global economic challenges to celebrate the annual Stampede, Conservative party leader Pierre Poilievre gave them even more to celebrate.
Poilievre returned to Calgary, his hometown, to outline his plan to amplify the legitimate demands of Western Canada and not only fight for oil and gas, but also fight for the interests of farmers, for low taxes, for decentralization, a stronger military and a smaller federal government.
Speaking at the annual Conservative party BBQ at Heritage Park in Calgary (a place Poilievre often visited on school trips growing up), he was reminded of the challenges his family experienced during the years when Trudeau senior was Prime Minister and the disastrous effect of his economic policies.
“I was born in ’79,” Poilievre said. “and only a few years later, Pierre Elliott Trudeau would attack our province with the National Energy Program. There are still a few that remember it. At the same time, he hammered the entire country with money printing deficits that gave us the worst inflation and interest rates in our history. Our family actually lost our home, and we had to scrimp and save and get help from extended family in order to get our little place in Shaughnessy, which my mother still lives in.”
This very personal story resonated with many in the crowd who are now experiencing an affordability crisis that leaves families struggling and young adults unable to afford their first house or condo. Poilievre said that the experience was a powerful motivator for his entry into politics. He wasted no time in proposing a solution – build alliances with other provinces with mutual interests, and he emphasized the importance of advocating for provincial needs.
“Let’s build an alliance with British Columbians who want to ship liquefied natural gas out of the Pacific Coast to Asia, and with Saskatchewanians, Newfoundlanders and Labradorians who want to develop their oil and gas and aren’t interested in having anyone in Ottawa cap how much they can produce. Let’s build alliances with Manitobans who want to ship oil in the port of Churchill… with Quebec and other provinces that want to decentralize our country and get Ottawa out of our business so that provinces and people can make their own decisions.”
Poilievre heavily criticized the federal government’s spending and policies of the last decade, including the increase in government costs, and he highlighted the negative impact of those policies on economic stability and warned of the dangers of high inflation and debt. He advocated strongly for a free-market economy, advocating for less government intervention, where businesses compete to impress customers rather than impress politicians. He also addressed the decade-long practice of blocking and then subsidizing certain industries. Poilievre referred to a famous quote from Ronald Reagan as the modus operandi of the current federal regime.
“The Government’s view of the economy could be summed up in a few short phrases. If anything moves, tax it. If it keeps moving, regulate it. And if it stops moving, subsidize it.”
The practice of blocking and then subsidizing is merely a ploy to grab power, according to Poilievre, making industry far too reliant on government control.
“By blocking you from doing something and then making you ask the government to help you do it, it makes you reliant. It puts them at the center of all power, and that is their mission…a full government takeover of our economy. There’s a core difference between an economy controlled by the government and one controlled by the free market. Businesses have to clamour to please politicians and bureaucrats. In a free market (which we favour), businesses clamour to impress customers. The idea is to put people in charge of their economic lives by letting them have free exchange of work for wages, product for payment and investment for interest.”
Poilievre also said he plans to oppose any ban on gas-powered vehicles, saying, “You should be in the driver’s seat and have the freedom to decide.” This is in reference to the Trudeau-era plan to ban the sale of gas-powered cars by 2035, which the Carney government has said they have no intention to change, even though automakers are indicating that the targets cannot be met. He also intends to oppose the Industrial Carbon tax, Bill C-69 the Impact Assessment Act, Bill C-48 the Oil tanker ban, the proposed emissions cap which will cap energy production, as well as the single-use plastics ban and Bill C-11, also known as the Online Streaming Act and the proposed “Online Harms Act,” also known as Bill C-63. Poilievre closed with rallying thoughts that had a distinctive Western flavour.
“Fighting for these values is never easy. Change, as we’ve seen, is not easy. Nothing worth doing is easy… Making Alberta was hard. Making Canada, the country we love, was even harder. But we don’t back down, and we don’t run away. When things get hard, we dust ourselves off, we get back in the saddle, and we gallop forward to the fight.”
Cowboy up, Mr. Poilievre.
Maureen McCall is an energy professional who writes on issues affecting the energy industry.
Alberta
Alberta and Ontario sign agreements to drive oil and gas pipelines, energy corridors, and repeal investment blocking federal policies
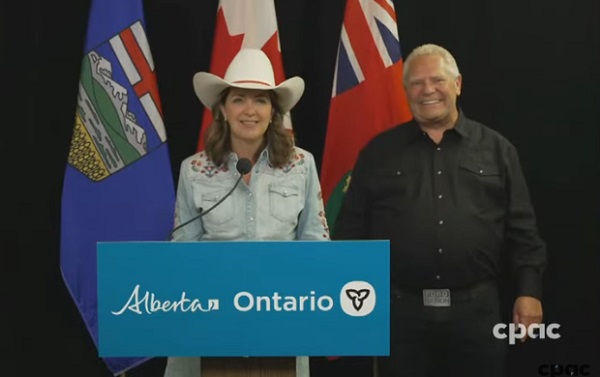
Alberta-Ontario MOUs fuel more pipelines and trade
Alberta Premier Danielle Smith and Ontario Premier Doug Ford have signed two memorandums of understanding (MOUs) during Premier Ford’s visit to the Calgary Stampede, outlining their commitment to strengthen interprovincial trade, drive major infrastructure development, and grow Canada’s global competitiveness by building new pipelines, rail lines and other energy and trade infrastructure.
The two provinces agree on the need for the federal government to address the underlying conditions that have harmed the energy industry in Canada. This includes significantly amending or repealing the Impact Assessment Act, as well as repealing the Oil Tanker Moratorium Act, Clean Electricity Regulations, the Oil and Gas Sector Greenhouse Gas Emissions Cap, and all other federal initiatives that discriminately impact the energy sector, as well as sectors such as mining and manufacturing. Taking action will ensure Alberta and Ontario can attract the investment and project partners needed to get shovels in the ground, grow industries and create jobs.
The first MOU focuses on developing strategic trade corridors and energy infrastructure to connect Alberta and Ontario’s oil, gas and critical minerals to global markets. This includes support for new oil and gas pipeline projects, enhanced rail and port infrastructure at sites in James Bay and southern Ontario, as well as end-to-end supply chain development for refining and processing of Alberta’s energy exports. The two provinces will also collaborate on nuclear energy development to help meet growing electricity demands while ensuring reliable and affordable power.
The second MOU outlines Alberta’s commitment to explore prioritizing made-in-Canada vehicle purchases for its government fleet. It also includes a joint commitment to reduce barriers and improve the interprovincial trade of liquor products.
“Alberta and Ontario are joining forces to get shovels in the ground and resources to market. These MOUs are about building pipelines and boosting trade that connects Canadian energy and products to the world, while advocating for the right conditions to get it done. Government must get out of the way, partner with industry and support the projects this country needs to grow. I look forward to working with Premier Doug Ford to unleash the full potential of our economy and build the future that people across Alberta and across the country have been waiting far too long for.”
“In the face of President Trump’s tariffs and ongoing economic uncertainty, Canadians need to work together to build the infrastructure that will diversify our trading partners and end our dependence on the United States. By building pipelines, rail lines and the energy and trade infrastructure that connects our country, we will build a more competitive, more resilient and more self-reliant economy and country. Together, we are building the infrastructure we need to protect Canada, our workers, businesses and communities. Let’s build Canada.”
These agreements build on Alberta and Ontario’s shared commitment to free enterprise, economic growth and nation-building. The provinces will continue engaging with Indigenous partners, industry and other governments to move key projects forward.
“Never before has it been more important for Canada to unite on developing energy infrastructure. Alberta’s oil, natural gas, and know-how will allow Canada to be an energy superpower and that will make all Canadians more prosperous. To do so, we need to continue these important energy infrastructure discussions and have more agreements like this one with Ontario.”
“These MOUs with Ontario build on the work Alberta has already done with Saskatchewan, Manitoba, Northwest Territories and the Port of Prince Rupert. We’re proving that by working together, we can get pipelines built, open new rail and port routes, and break down the barriers that hold back opportunities in Canada.”
“Canada’s economy has an opportunity to become stronger thanks to leadership and steps taken by provincial governments like Alberta and Ontario. Removing interprovincial trade barriers, increasing labour mobility and attracting investment are absolutely crucial to Canada’s future economic prosperity.”
Together, Alberta and Ontario are demonstrating the shared benefits and opportunities that result from collaborative partnerships, and what it takes to keep Canada competitive in a changing world.
Quick facts
- Steering committees with Alberta and Ontario government officials will be struck to facilitate work and cooperation under the agreements.
- Alberta and Ontario will work collaboratively to launch a preliminary joint feasibility study in 2025 to help move private sector led investments in rail, pipeline(s) and port(s) projects forward.
- These latest agreements follow an earlier MOU Premiers Danielle Smith and Doug Ford signed on June 1, 2025, to open up trade between the provinces and advance shared priorities within the Canadian federation.
Related information

Court compels RCMP and TD Bank to hand over records related to freezing of peaceful protestor’s bank accounts
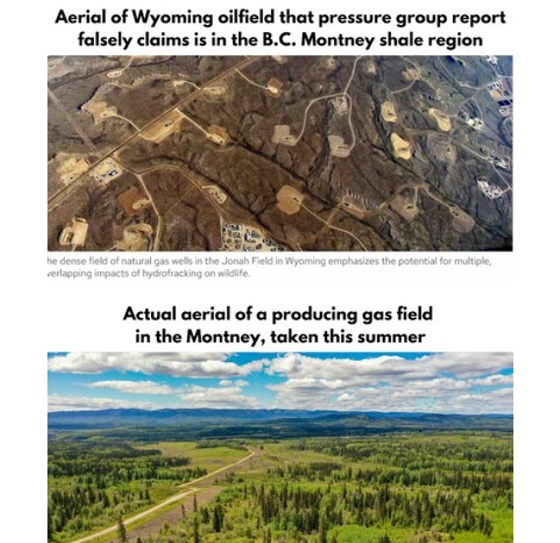
B.C. Residents File Competition Bureau Complaint Against David Suzuki Foundation for Use of False Imagery in Anti-Energy Campaigns

Alberta uncorks new rules for liquor and cannabis

Trump transportation secretary tells governors to remove ‘rainbow crosswalks’
-
 Daily Caller2 days ago
Trump’s One Big Beautiful Bill Resets The Energy Policy Playing Field
-
Alberta9 hours ago
COWBOY UP! Pierre Poilievre Promises to Fight for Oil and Gas, a Stronger Military and the Interests of Western Canada
-
 Alberta1 day ago
Alberta Next: Immigration
-
 Business2 days ago
The Digital Services Tax Q&A: “It was going to be complicated and messy”
-
 International2 days ago
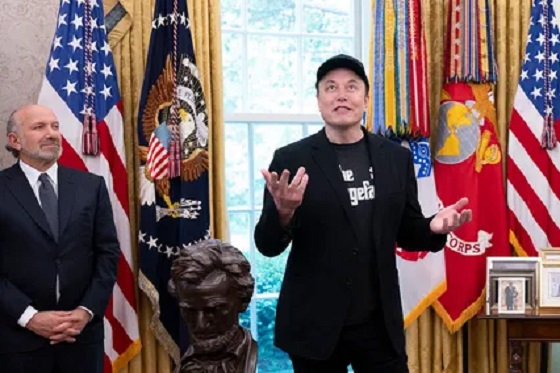
Elon Musk forms America Party after split with Trump
-
 Disaster2 days ago
Texas flood kills 43 including children at Christian camp
-
Alberta9 hours ago
Alberta and Ontario sign agreements to drive oil and gas pipelines, energy corridors, and repeal investment blocking federal policies
-
 COVID-1912 hours ago
FDA requires new warning on mRNA COVID shots due to heart damage in young men